 Coastal Bridge Client Portal

 One Charles Private Wealth Client Portal







The Bottom Line
Recent market activity is a reminder that changes in equity leadership can occur even while broad market indices remain near all-time highs. Just as the 2000s rewarded investment factors that had previously fallen out of favor, the recent rotation highlights the importance of diversification beyond the largest market leaders. Combining complementary equity strategies can help investors pursue better risk-adjusted returns while maintaining the long-term growth potential of their hard-earned capital.
The Full Story
Leading Factors
The cap weighted S&P 500 index sits just about 2.5% below its all-time closing high. All-time is a very long time, but the past few weeks have felt anything but dull. The VIX, which measures expected volatility for the index, sits at 19. Volatility in individual stocks has been more pronounced, though this is common during earnings season when company specific announcements drive large differences in stock performance. Expanding on last week's discussion of market rotation, the broader index may be relatively unchanged, but leadership beneath the surface is moving in different directions.
Factor Investing
Classic equity investment factors include value, quality, momentum, and low volatility. For each of those there is an opposing factor. For much of the AI buildout phase, from the market lows of October 2022 through the end of 2025, growth and momentum stocks have far outperformed their counterparts:
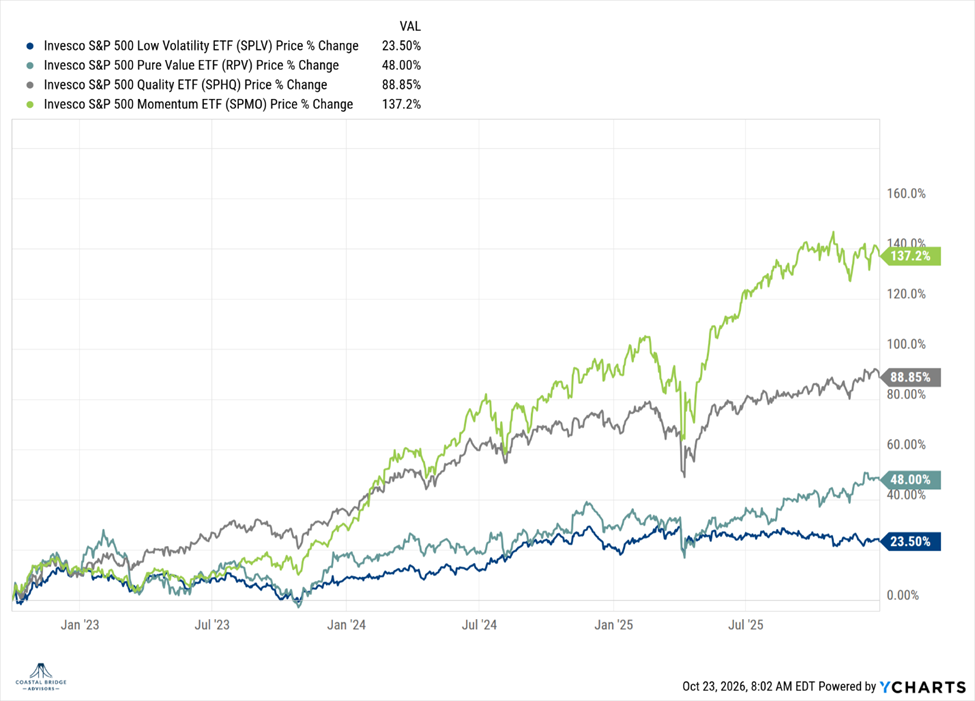
Source: YCharts. Performance measured from October 1, 2022, through December 31, 2025. Past performance is not indicative of future results.
Look back further, and the results favor growth and momentum even more. Consequently, as those stocks are an increasingly large percentage of the cap-weighted stock indices, investors in cap-weighted index funds have become increasingly dependent on growth and momentum stocks to drive returns. Meanwhile, value, quality, and low volatility strategies have largely been left for dead on the side of the road. But market leadership has a habit of changing, and sometimes can do so for long periods of time.
Lessons from the Lost Decade
We have seen this movie before. The tech boom of the late 1990s produced outsized returns for growth and momentum investors. Market leadership became increasingly concentrated in technology, driving the broader index higher. Eventually, the tech boom went bust, and the largest contributors to market returns became its biggest detractors.
Expand the period to what we commonly know as the ‘lost decade’ from 2000 through 2010, and the compounded annual returns tell a story worth remembering:
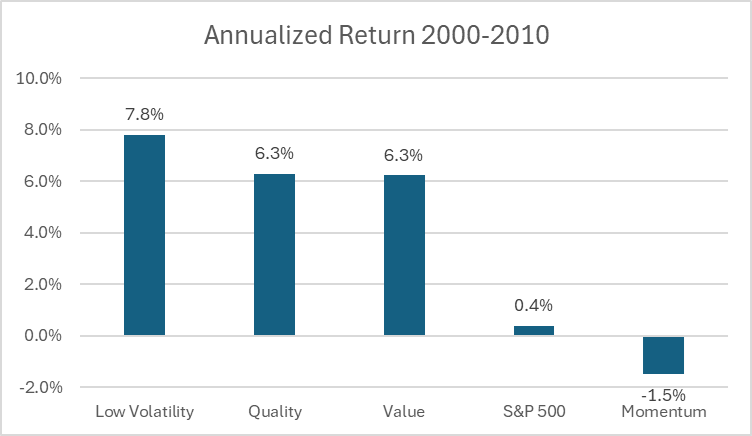
Source: Pacer Advisors, Value represented by S&P Enhanced Value Index. Momentum represented by S&P 500 Momentum Index. Quality represented by the S&P 500 Quality Index. Low Volatility represented by the S&P 500 Low Volatility Index. Index returns are presented for comparison purposes and do not represent actual investment results. Past performance is not indicative of future results.
Over those years, investors in the S&P 500 earned just 0.4% annually, while momentum strategies lost approximately 1.5% annually. However, investors with exposure to low volatility, quality, and value factors experienced considerably better results, with each returning more than 6% per year.
The point isn't that growth and momentum are inherently poor investments. Rather, factors that dominate returns during one market cycle can fall out of favor during the next. For investors depending on their portfolios to fund long term financial goals, those differences can be material to the health of their financial plans.
Back to the Future
Back to today, while the cap-weighted S&P 500 remains near it high water mark, the factors driving returns are moving. Consider the performance of different factors and indices since the beginning of October:
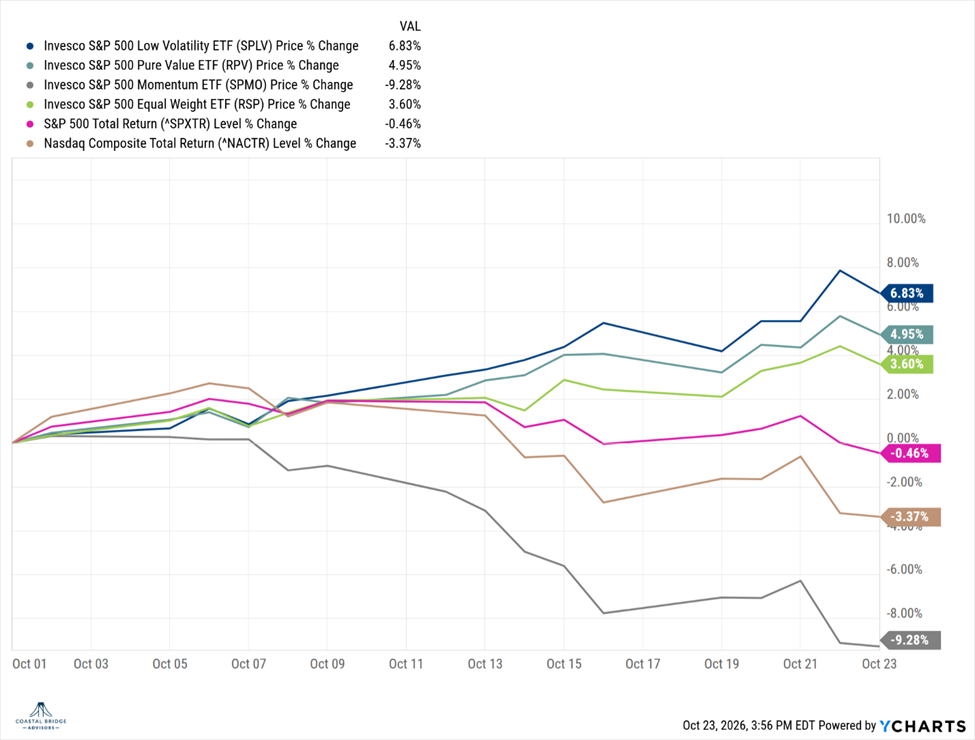
Source: YCharts. Performance measured from October 1, 2026, through October 22, 2026. Index returns are presented for comparison purposes and do not represent actual investment results. Past performance is not indicative of future results.
Low volatility stocks have gained approximately 7%, while value stocks have risen 5%. The equal-weighted S&P 500 has advanced 3.6%, even as the traditional cap-weighted index has declined 0.46%. Meanwhile, the Nasdaq 100 has fallen nearly 4%, and momentum stocks have declined approximately 9%.
That's a large 16-point difference between the best and worst performing factors in just a few weeks. So far, Q4 has brought a shift in leadership reminiscent and rhyming of the period following the tech bubble. This doesn't imply today's market is destined to repeat the experience of 2000s. Companies, earnings, valuations, and economic circumstances are different but it does offer a reminder that market returns and portfolio returns can be very different things.
Investors naturally gravitate toward what has worked most recently. Yet the very characteristics that produced exceptional returns in one environment can become sources of risk when market leadership changes. Combining value, quality, momentum, and low volatility can help reduce dependence on any single source of returns.
A prepared equity portfolio isn't necessarily the one that performs best when markets are rising. It's one designed to participate in long-term market growth while managing the risks that inevitably emerge along the way.
Have a great week!
- Matt
Matt Gentzkow CIMA®
Managing Director, Wealth Advisor
Matt Gentzkow is Managing Director and Wealth Advisor at Coastal Bridge Advisors, where he shares his insights with the investment committee and guides clients toward their financial goals. Before joining the firm, he held advisory and wealth strategy roles at UBS and Morgan Stanley. Matt earned bachelor's degrees in finance and economics from Xavier University and is a Certified Investment Management Analyst® (CIMA®). His market insights have been featured in publications including The Wall Street Journal and Kiplinger.
Sources: Ycharts, Pacer Advisors
The views and opinions expressed are those of Matt Gentzkow, CIMA® as of the date of publication and are subject to change without notice. This material is provided for informational and educational purposes only and is not intended to constitute investment advice or a recommendation to buy or sell any security. The information and opinions expressed are based on sources believed to be reliable, including third-party sources, but are not guaranteed as to accuracy or completeness. Third-party information has not been independently verified by CBA. Any forward-looking statements or hypothetical examples are for illustrative purposes only and are subject to change based on market and economic conditions. Past performance is not indicative of future results.