
Last week, we received word that the US economy grew 4.9% in the third quarter. Consumer spending (amplified by Swifty Stimulus) powered the bulk of that advance. For US GDP growth to continue growing, consumers must continue spending.
While savings depletion and credit usage add to spending, it’s jobs and wages that drive it. Therefore, strength in the job market drives strength in spending, strength across the economy, and strength in corporate earnings.
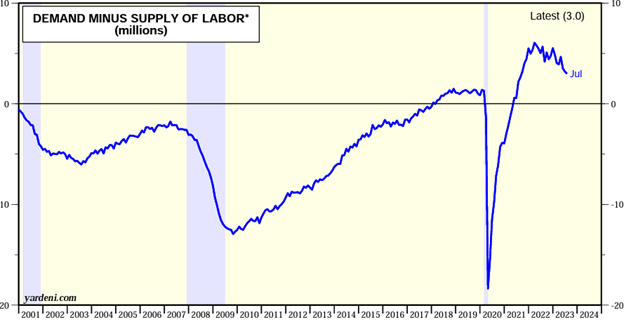
The headline above refers to the Job Openings and Labor Turnover Survey released on Wednesday by the US Bureau of Labor Statistics. According to the report, job openings rose slightly over the previous month to 9.6 million, equating to 1.5 jobs available for each unemployed worker. This remains a very strong job market, but the market has trended back toward more balanced conditions between worker supply and worker demand as the following chart demonstrates:
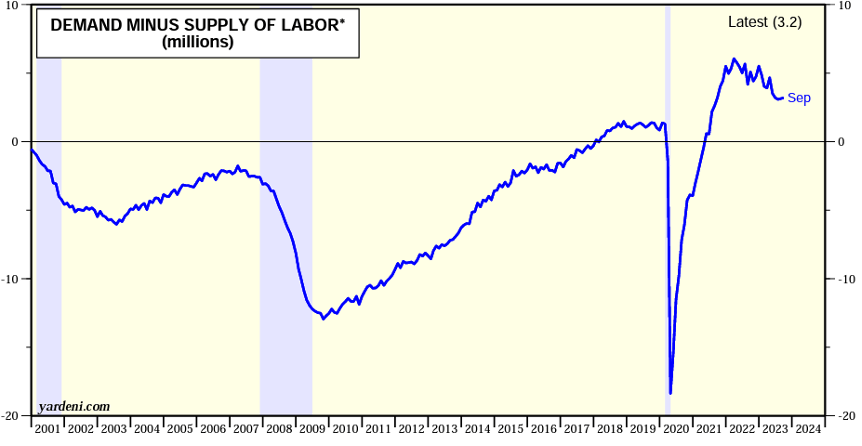
Powell has cited reclamation of equilibrium between labor supply and labor demand as one of his primary objectives. As you can see, while demand still outstrips supply, conditions are trending towards desired equilibrium.
As referenced in the headline, while jobs remain plentiful, quit rates and layoffs have hit pre-pandemic levels. Quit rates matter to economists because they measure worker confidence. You will only ballad, “take this job and shove it” if you know that another, better paying job is available.
The less workers believe that the grass is greener, the fewer quits and wage renegotiations. Employers also pink-slipped 1% of laborers, consistent with a steady but forgiving environment. So, while the economy added jobs in September, quit rates and layoff rates suggest easing wage pressures. This Goldilocks report gets a 10 out of 10.
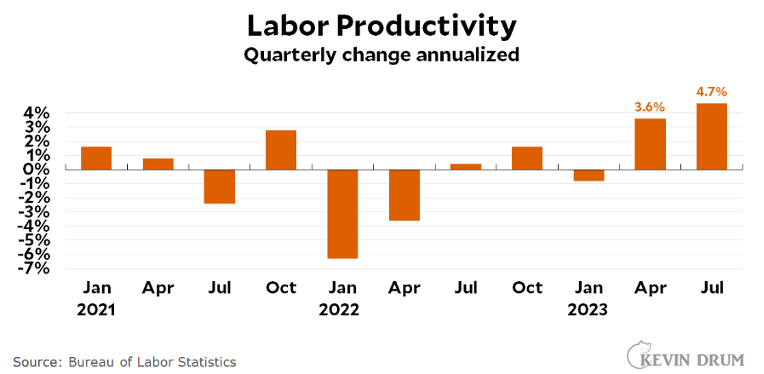
Reinforcing the JOLTS suggestion of softening wage conditions, the Labor Department also released its quarterly report on productivity and unit labor costs. Within the 3rd quarter, unit labor costs increased 3.9%, but labor productivity surged by 4.7%. This means corporations generated 4.7% more stuff and only had to pay workers 3.9% for it. That translates into a decline in unit labor costs of 0.8%!
In economics, nothing provides more benefit to society than increasing productivity. Productivity gains power quality of life gains as less input generates more output. Productivity in the US has surged over the last two quarters to its highest levels in 15 years (save the pandemic surge due to mass layoffs) as labor and supply shortages forced companies to innovate processes and renovate organizational structures:
Mix in the early integration of AI, and the US may have just entered a major productivity upgrade cycle. As corporations become more efficient, economies grow without corresponding inflation growth. This Goldilocks report also receives a 10 out of 10.

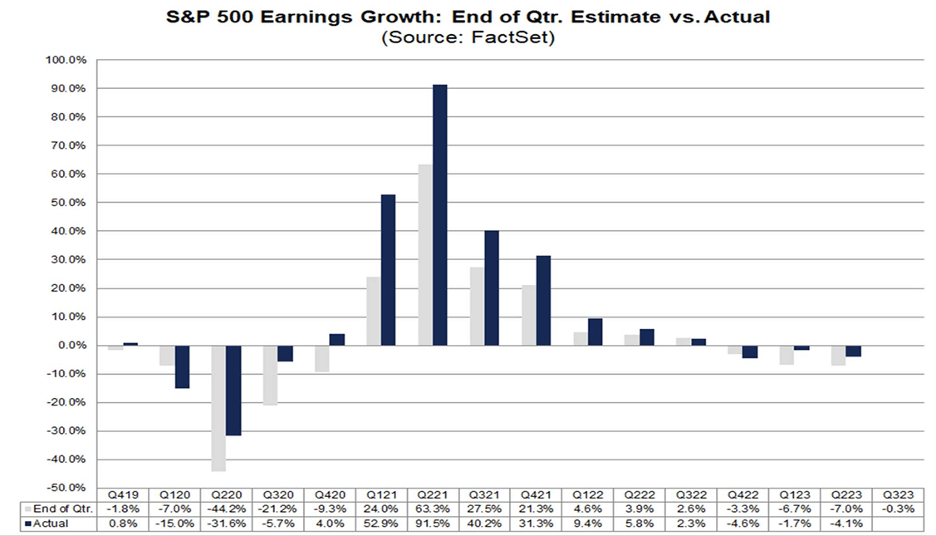
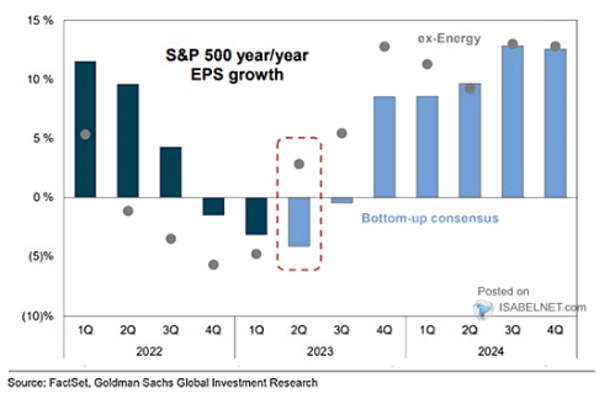
Strong economic growth, high productivity and lower wage pressures should alchemize into higher corporate earnings reports. And so, they have! S&P 500 earnings likely hit record levels last quarter. So far, 341 of the 500 companies within the S&P 500 have reported with aggregate earnings growth now projected at 3.4% versus the -1% anticipated before the reporting season began. Furthermore, the resumption of growth rather than declines should continue unabated next year as seen in the estimates below:
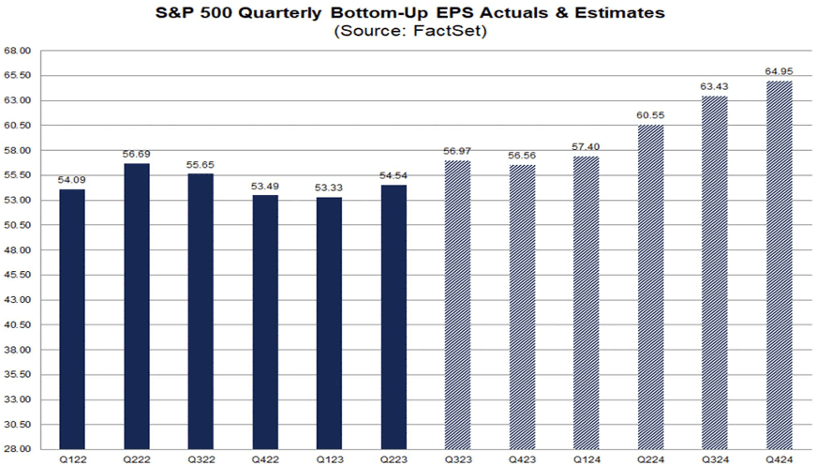
Using simple arithmetic, if we annualize the Q4 2024 projection of $65 in earnings per share for the S&P 500, we get $260. With interest rates cooling back toward 4.5% on the 10-year, the market could easily support a 19x P/E.
Multiplying $260 by 19 produces a potential price level near $5,000 for the index next year. We closed Friday near $4,350. After three consecutive quarters of negative earnings growth, the initiation of positive growth this quarter, and for quarters to come, receives another Goldilocks 10 out of 10.

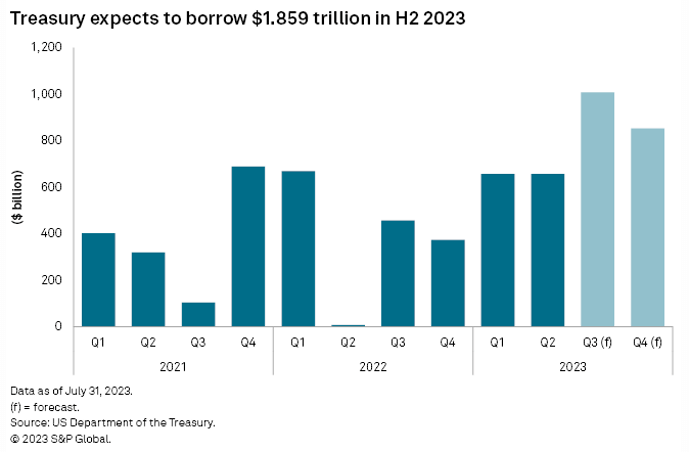
Of all the happy headlines this week, none provided more rally fuel than this one. A fierce debate has broken out among economic disciplinarians around the ability of the global marketplace to finance ballooning fiscal deficits in the US. The spike in long-term interest rates over the past quarter corresponded with a large surprise in scheduled treasury auctions, and underwhelming demand for longer dated maturities. Fortunately, the Treasury took notice.
On Wednesday, the Treasury announced that it will issue fewer bonds than expected this quarter and will weight issuance toward shorter dated maturities, removing upward yield pressure on longer-dated maturities. The yield on the 10-year bond dropped from 4.8% to 4.57%, sparking a stock market surge as lower yields accommodate higher valuations and lower funding costs boost earnings potential. We do not comment on the Treasury Refunding releases often, but this Goldilocks market mover received a 10 out of 10.

Bravo, Chairman Powell! Your FOMC comments and press conference provided EXACTLY what this rally needed to break out of jail. To summarize his comments:
- Disinflation across the economy remains on trend.
- Labor market growth remains on trend.
- Labor inflation has now returned to levels consistent with our 2% inflation target.
- Labor demand and supply factors are rebalancing, a healthy precondition for disinflation.
- GDP growth rates are averaging out below potential, a healthy precondition for disinflation.
- We do not see a recession on the horizon.
- Longer-term inflation expectations remain near our 2% target.
- The recent rise in the dollar, the rise in yields, and the fall in the stock markets have tightened financial conditions organically, reducing tighter policy requirements.
- We do not see any need to raise rates further or cut rates at this time.
- We do not believe the events in the Middle East will impact the economy.
Standing ovation, please! Often, Fed Chairs tilt their comments to punish or reward markets. What made this testimony so compelling was Powell’s synthesis of truth. As seen in the headlines above, his comments align with the positive indicators of growth and disinflation recently reported. The market needed a jolt of confidence, but this was no manipulation. I will end this section with the following Goldilocks revelation he made during his 10-out-of-10 press conference:
“Well, I think everyone has been very gratified to see that we’ve been able to achieve, you know, pretty significant progress on inflation without seeing the kind of increase in unemployment that has been very typical of rate-hiking cycles like this one. That’s historically unusual and a very welcome result.”
Indeed, Mr. Powell!
David S. Waddell
CEO, Chief Investment Strategist
Source: Yardeni, FactSet, Bureau of Labor Statistics
This communication and its contents are for informational and educational purposes only and should not be used as the sole basis for any investment decision. The information contained herein is based on publicly available sources believed to be reliable but is not a representation, expressed or implied, as to the accuracy, completeness, or correctness of said information. Past performance does not guarantee future results.
">Get Your Happy Headlines Here!
Last week, we received word that the US economy grew 4.9% in the third quarter. Consumer spending (amplified by Swifty Stimulus) powered the bulk of that advance. For US GDP growth to continue growing, consumers must continue spending.
While savings depletion and credit usage add to spending, it’s jobs and wages that drive it. Therefore, strength in the job market drives strength in spending, strength across the economy, and strength in corporate earnings.
The headline above refers to the Job Openings and Labor Turnover Survey released on Wednesday by the US Bureau of Labor Statistics. According to the report, job openings rose slightly over the previous month to 9.6 million, equating to 1.5 jobs available for each unemployed worker. This remains a very strong job market, but the market has trended back toward more balanced conditions between worker supply and worker demand as the following chart demonstrates:
Powell has cited reclamation of equilibrium between labor supply and labor demand as one of his primary objectives. As you can see, while demand still outstrips supply, conditions are trending towards desired equilibrium.
As referenced in the headline, while jobs remain plentiful, quit rates and layoffs have hit pre-pandemic levels. Quit rates matter to economists because they measure worker confidence. You will only ballad, “take this job and shove it” if you know that another, better paying job is available.
The less workers believe that the grass is greener, the fewer quits and wage renegotiations. Employers also pink-slipped 1% of laborers, consistent with a steady but forgiving environment. So, while the economy added jobs in September, quit rates and layoff rates suggest easing wage pressures. This Goldilocks report gets a 10 out of 10.
Reinforcing the JOLTS suggestion of softening wage conditions, the Labor Department also released its quarterly report on productivity and unit labor costs. Within the 3rd quarter, unit labor costs increased 3.9%, but labor productivity surged by 4.7%. This means corporations generated 4.7% more stuff and only had to pay workers 3.9% for it. That translates into a decline in unit labor costs of 0.8%!
In economics, nothing provides more benefit to society than increasing productivity. Productivity gains power quality of life gains as less input generates more output. Productivity in the US has surged over the last two quarters to its highest levels in 15 years (save the pandemic surge due to mass layoffs) as labor and supply shortages forced companies to innovate processes and renovate organizational structures:
Mix in the early integration of AI, and the US may have just entered a major productivity upgrade cycle. As corporations become more efficient, economies grow without corresponding inflation growth. This Goldilocks report also receives a 10 out of 10.
Strong economic growth, high productivity and lower wage pressures should alchemize into higher corporate earnings reports. And so, they have! S&P 500 earnings likely hit record levels last quarter. So far, 341 of the 500 companies within the S&P 500 have reported with aggregate earnings growth now projected at 3.4% versus the -1% anticipated before the reporting season began. Furthermore, the resumption of growth rather than declines should continue unabated next year as seen in the estimates below:
Using simple arithmetic, if we annualize the Q4 2024 projection of $65 in earnings per share for the S&P 500, we get $260. With interest rates cooling back toward 4.5% on the 10-year, the market could easily support a 19x P/E.
Multiplying $260 by 19 produces a potential price level near $5,000 for the index next year. We closed Friday near $4,350. After three consecutive quarters of negative earnings growth, the initiation of positive growth this quarter, and for quarters to come, receives another Goldilocks 10 out of 10.
Of all the happy headlines this week, none provided more rally fuel than this one. A fierce debate has broken out among economic disciplinarians around the ability of the global marketplace to finance ballooning fiscal deficits in the US. The spike in long-term interest rates over the past quarter corresponded with a large surprise in scheduled treasury auctions, and underwhelming demand for longer dated maturities. Fortunately, the Treasury took notice.
On Wednesday, the Treasury announced that it will issue fewer bonds than expected this quarter and will weight issuance toward shorter dated maturities, removing upward yield pressure on longer-dated maturities. The yield on the 10-year bond dropped from 4.8% to 4.57%, sparking a stock market surge as lower yields accommodate higher valuations and lower funding costs boost earnings potential. We do not comment on the Treasury Refunding releases often, but this Goldilocks market mover received a 10 out of 10.
Bravo, Chairman Powell! Your FOMC comments and press conference provided EXACTLY what this rally needed to break out of jail. To summarize his comments:
- Disinflation across the economy remains on trend.
- Labor market growth remains on trend.
- Labor inflation has now returned to levels consistent with our 2% inflation target.
- Labor demand and supply factors are rebalancing, a healthy precondition for disinflation.
- GDP growth rates are averaging out below potential, a healthy precondition for disinflation.
- We do not see a recession on the horizon.
- Longer-term inflation expectations remain near our 2% target.
- The recent rise in the dollar, the rise in yields, and the fall in the stock markets have tightened financial conditions organically, reducing tighter policy requirements.
- We do not see any need to raise rates further or cut rates at this time.
- We do not believe the events in the Middle East will impact the economy.
Standing ovation, please! Often, Fed Chairs tilt their comments to punish or reward markets. What made this testimony so compelling was Powell’s synthesis of truth. As seen in the headlines above, his comments align with the positive indicators of growth and disinflation recently reported. The market needed a jolt of confidence, but this was no manipulation. I will end this section with the following Goldilocks revelation he made during his 10-out-of-10 press conference:
“Well, I think everyone has been very gratified to see that we’ve been able to achieve, you know, pretty significant progress on inflation without seeing the kind of increase in unemployment that has been very typical of rate-hiking cycles like this one. That’s historically unusual and a very welcome result.”
Indeed, Mr. Powell!
David S. Waddell
CEO, Chief Investment Strategist
Source: Yardeni, FactSet, Bureau of Labor Statistics
This communication and its contents are for informational and educational purposes only and should not be used as the sole basis for any investment decision. The information contained herein is based on publicly available sources believed to be reliable but is not a representation, expressed or implied, as to the accuracy, completeness, or correctness of said information. Past performance does not guarantee future results.
" class="link-chevron">
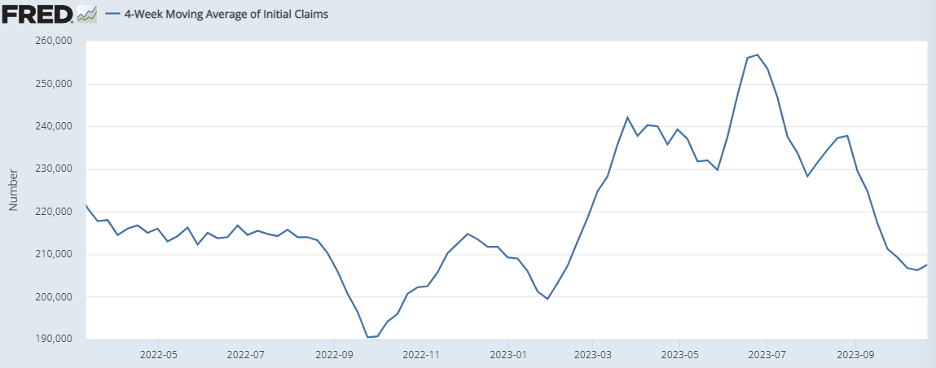
As we discussed last week, this more-than-doubling of GDP growth over the last quarter explains the sudden 25% rise in Treasury yields, but for the economy to continue expansion as the Treasury yields suggest, consumers need to continue their spendthrift ways through the holiday season. This requires income. As of the end of September, the U.S. unemployment rate of 3.8% remained at historical lows. Since then, we have not seen any material change. In fact, unemployment claims, as highlighted below, have fallen over the past month:
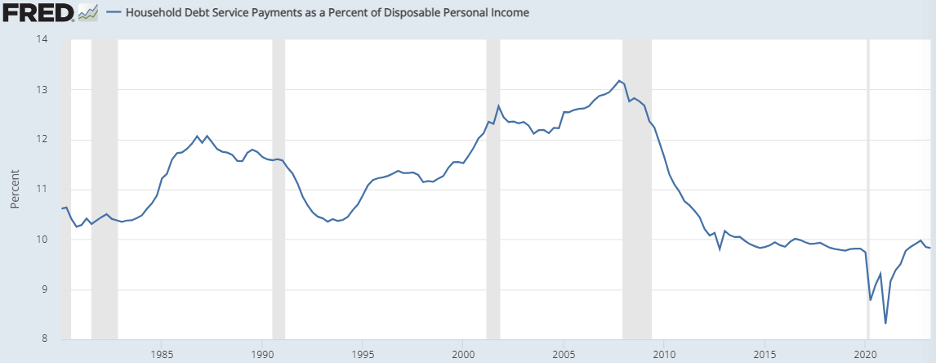
While wage inflation rates have slowed, the most recent readings remain at rates twice as high as pre-pandemic levels. Additionally, although markets have contracted, household net worth remains near record levels. Lastly, while higher rates increase debt-carrying costs, current household debt service levels remain near historic lows:
Consumer distress tends to follow corporate distress, and a quick check of high yield credit spreads reading 4.3% also remains in line with pre-pandemic levels. While layoffs may indeed be forthcoming, the U.S. economy continues to post 1.5 job openings for each unemployed worker. Based upon this analysis, consumer spending capabilities remain intact, which will continue to support GDP Growth.
Thursday’s GDP release also contained an encouraging read on inflation. While the headline Personal Consumption Expenditures (PCE) inflation rate jumped 3%, the Fed’s preferred measure of core inflation only rose 2.4%, well within striking distance of the Fed’s 2% target.
Overall, the economy grew robustly in the third quarter while inflation continued its glidepath lower. In response, the futures market currently prices in an 80% probability that the Fed will not raise rates any further this year.
Corporate Earnings
Thirty percent of S&P 500 companies have now released their third quarter earnings results. Roughly 80% of these companies have beaten expectations. Blending actual results and expected results, analysts now expect S&P 500 earnings will grow by more than 1% for the quarter versus expectations of a 1% loss as the reporting season began.
While that’s good news, the market hasn’t rewarded companies for their successes. Historically, when companies exceed both revenue and earnings expectations, their stocks rallied 1.1% on the day of the release, on average. So far this quarter, companies that have exceeded revenue and earnings expectations haven’t seen any lift in share prices. Revealing that in the current environment, more than math is at stake.
TIA – There Is an Alternative
During the long period of time when the Fed used zero interest rate policy and quantitative easing to suppress interest rates, Wall Street created the TINA acronym to explain the stock market’s resilience.TINA stood for “There Is No Alternative” because with bonds yielded nothing, investors had to own stocks to generate returns.
To quantify this argument, we can compare bond yields in the bond market with earnings yields in the stock market to reveal relative value. Consider the following chart:
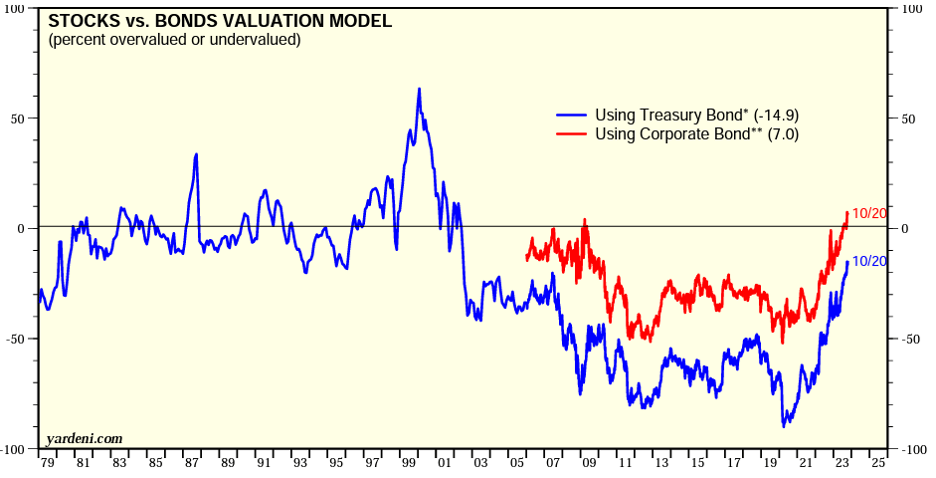
The S&P 500 currently trades at 17.5 times earnings. Inverting this multiple derives an earnings yield of 5.7%. When bond yields sat in the low single digits, stocks had no competition. However, today, with Treasury bonds yielding 5% and corporate bonds yielding 6%, TIA – There Is an Alternative! Investors struggling with harrowing headlines are no longer forced into stocks to seek returns given their valuation parity levels with bonds.
This significant change certainly benefits investors, but it also removes marginal demand for stocks. A year ago, with bonds yielding less than 4%, a 6% earnings yield for stocks warranted thicker skin,but with yields equivalent today, skittish investors can simply defer equity purchase decisions until conditions clear.
However, mathematically, if earnings rise without rising share prices, the earnings yield advantage for stocks will grow. While analysts only see 1% growth in Q3, they see 11% growth in Q4, and 12% in 2024, making this moment mathematically attractive for more fearless allocators.
When Then?
Unfortunately, geopolitics has incarcerated our year-end rally. To liberate, we either need better headlines or much lower bullish sentiment levels. Last week’s AAII bullish survey rate stood at 29.3%, higher than levels hit in late September when our latest rally attempt began.
To provide further confirmation that fear has reached surmountable levels, we may also need the VIX volatility index to climb back towards its Silicon Valley Bank failure highs. The VIX topped closer to 30 then and sits around 20 now.
In sum, while the math reads favorable for stock market investors, the headlines do not. Combining headline anxiety with the 5-6% yields offered in bonds creates a formidable competitor for stocks. Until headlines improve, or sentiment drops to contrarian extremes… Santa remains sequestered.
Have a great weekend & Happy Halloween!
David S. Waddell
CEO, Chief Investment Strategist
Source: Wall Street Journal Survey of Economists, Fred Database, Yardeni
This communication and its contents are for informational and educational purposes only and should not be used as the sole basis for any investment decision. The information contained herein is based on publicly available sources believed to be reliable but is not a representation, expressed or implied, as to the accuracy, completeness, or correctness of said information. Past performance does not guarantee future results.
">Rally Incarceration
As we discussed last week, this more-than-doubling of GDP growth over the last quarter explains the sudden 25% rise in Treasury yields, but for the economy to continue expansion as the Treasury yields suggest, consumers need to continue their spendthrift ways through the holiday season. This requires income. As of the end of September, the U.S. unemployment rate of 3.8% remained at historical lows. Since then, we have not seen any material change. In fact, unemployment claims, as highlighted below, have fallen over the past month:
While wage inflation rates have slowed, the most recent readings remain at rates twice as high as pre-pandemic levels. Additionally, although markets have contracted, household net worth remains near record levels. Lastly, while higher rates increase debt-carrying costs, current household debt service levels remain near historic lows:
Consumer distress tends to follow corporate distress, and a quick check of high yield credit spreads reading 4.3% also remains in line with pre-pandemic levels. While layoffs may indeed be forthcoming, the U.S. economy continues to post 1.5 job openings for each unemployed worker. Based upon this analysis, consumer spending capabilities remain intact, which will continue to support GDP Growth.
Thursday’s GDP release also contained an encouraging read on inflation. While the headline Personal Consumption Expenditures (PCE) inflation rate jumped 3%, the Fed’s preferred measure of core inflation only rose 2.4%, well within striking distance of the Fed’s 2% target.
Overall, the economy grew robustly in the third quarter while inflation continued its glidepath lower. In response, the futures market currently prices in an 80% probability that the Fed will not raise rates any further this year.
Corporate Earnings
Thirty percent of S&P 500 companies have now released their third quarter earnings results. Roughly 80% of these companies have beaten expectations. Blending actual results and expected results, analysts now expect S&P 500 earnings will grow by more than 1% for the quarter versus expectations of a 1% loss as the reporting season began.
While that’s good news, the market hasn’t rewarded companies for their successes. Historically, when companies exceed both revenue and earnings expectations, their stocks rallied 1.1% on the day of the release, on average. So far this quarter, companies that have exceeded revenue and earnings expectations haven’t seen any lift in share prices. Revealing that in the current environment, more than math is at stake.
TIA – There Is an Alternative
During the long period of time when the Fed used zero interest rate policy and quantitative easing to suppress interest rates, Wall Street created the TINA acronym to explain the stock market’s resilience.TINA stood for “There Is No Alternative” because with bonds yielded nothing, investors had to own stocks to generate returns.
To quantify this argument, we can compare bond yields in the bond market with earnings yields in the stock market to reveal relative value. Consider the following chart:
The S&P 500 currently trades at 17.5 times earnings. Inverting this multiple derives an earnings yield of 5.7%. When bond yields sat in the low single digits, stocks had no competition. However, today, with Treasury bonds yielding 5% and corporate bonds yielding 6%, TIA – There Is an Alternative! Investors struggling with harrowing headlines are no longer forced into stocks to seek returns given their valuation parity levels with bonds.
This significant change certainly benefits investors, but it also removes marginal demand for stocks. A year ago, with bonds yielding less than 4%, a 6% earnings yield for stocks warranted thicker skin,but with yields equivalent today, skittish investors can simply defer equity purchase decisions until conditions clear.
However, mathematically, if earnings rise without rising share prices, the earnings yield advantage for stocks will grow. While analysts only see 1% growth in Q3, they see 11% growth in Q4, and 12% in 2024, making this moment mathematically attractive for more fearless allocators.
When Then?
Unfortunately, geopolitics has incarcerated our year-end rally. To liberate, we either need better headlines or much lower bullish sentiment levels. Last week’s AAII bullish survey rate stood at 29.3%, higher than levels hit in late September when our latest rally attempt began.
To provide further confirmation that fear has reached surmountable levels, we may also need the VIX volatility index to climb back towards its Silicon Valley Bank failure highs. The VIX topped closer to 30 then and sits around 20 now.
In sum, while the math reads favorable for stock market investors, the headlines do not. Combining headline anxiety with the 5-6% yields offered in bonds creates a formidable competitor for stocks. Until headlines improve, or sentiment drops to contrarian extremes… Santa remains sequestered.
Have a great weekend & Happy Halloween!
David S. Waddell
CEO, Chief Investment Strategist
Source: Wall Street Journal Survey of Economists, Fred Database, Yardeni
This communication and its contents are for informational and educational purposes only and should not be used as the sole basis for any investment decision. The information contained herein is based on publicly available sources believed to be reliable but is not a representation, expressed or implied, as to the accuracy, completeness, or correctness of said information. Past performance does not guarantee future results.
" class="link-chevron">
Note that the near-perfect long-term relationship between Treasury yields and Nominal GDP weakened over the past 20 years. What could have caused that distortion?

Over the past 20 years, the US Federal Reserve bought $8 trillion worth of bonds to intentionally suppress longer-term interest rates… to intentionally boost nominal GDP. This explains the gap between nominal GDP and Treasury rates. It was by design! That effort has now reversed, with the Fed selling $1 trillion worth of bonds over the past year to intentionally boost longer-term interest rates… to intentionally suppress nominal GDP. It is, therefore, no coincidence that long-term interest rates have doubled since the Fed’s bond sales began. It’s by design! For this reason, one could argue that, unlike the last 20 years when nominal GDP well exceeded the 10-year Treasury yield, the inverse could now occur where 10-year Treasury yields well exceed Nominal GDP. Maybe. But it’s highly unlikely that the Fed will continue to sell bonds for the next 20 years. Most observers expect the Fed to continue shrinking its balance sheet for another year or two, totaling between $1 trillion to $2 trillion in sales. With that being the case, the more traditional parity relationship between nominal GDP and the 10-year Treasury bond should reappear. Therefore, to correctly forecast long-term interest rates, we must properly forecast nominal GDP.
Forecasting longer-term economic growth isn’t actually that difficult. Economic growth depends on labor force growth and labor productivity growth. Labor force growth is easy to forecast as tomorrow’s workforce has already been born. Productivity forecasts provide a greater challenge but tend to average between 1-2% depending on innovation cycles. Based on the CBO’s estimate, here is what we can expect from inflation-adjusted GDP growth over the next ten-plus years:

The CBO’s 1.8% GDP growth estimate over the next decade could prove low if immigration levels rise and/or technological advances (such as AI) boost productivity. As an optimist and a believer in the power of AI, I will adjust this figure up to 2.2% for our purposes.
To finish our nominal GDP forecast we must properly estimate inflation. Here is a long-term look at CPI inflation trends. Note the historic spikes in inflation correlate with the fiscal and monetary policy mistakes of the 1970s and the unprecedented stimulus measures deployed during COVID:

Removing the inflation of the 1970’s and COVID era, long-term consumer price inflation since 1965 averages about 2.5%. The modern US Federal Reserve has adopted a 2% inflation target that it rebroadcasts every chance it gets. Based on their own forecast, inflation should return to 2% by 2026. According to the futures markets, inflation will run slightly higher, averaging its more traditional 2.5% over the next ten years. We tend to agree more with the markets than govies and will therefore add 2.5% inflation to our 2.2% GDP figure, deriving a nominal GDP estimate of 4.7% over the next ten years.
Using 4.7% as our baseline for nominal GDP growth allows us to baseline our 10-year treasury yield expectation at 4.7% as well. For those who want to raise that yield estimate for Fed bond sales over the next couple of years, tack on another .5%. This takes you to 5.2%. For those who want to raise the yield premium further for the potential of a ratings downgrade or Fed default over the next couple of years, tack on another .25%. This takes you to 5.5%. Barring some market catastrophe, 5.5% feels like a sensible upward bound. However, this 10-year forward analysis doesn’t help us forecast rates over the next quarter… but history offers near-term comfort here as well.
Last quarter (Q2), nominal GDP grew 3.8%. The 10-Year Treasury exited the quarter at 3.8% as well. The 10-Year Treasury currently yields 5%, suggesting a 5% nominal GDP growth rate for Q3. This is certainly possible as economic momentum has increased, but it’s highly unlikely to maintain that pace for subsequent quarters and represents a clear counter-trend:

The recent record on the path for interest rates after quarters where they exceeded nominal GDP growth rates is consistent. Either GDP rates rise (unlikely) or interest rates fall (likely). Therefore, as nominal GDP stabilizes under 5%, we expect interest rates will stabilize there as well.
Have a great week!
David S. Waddell
CEO, Chief Investment Strategist
Source: Fred Database, CBO
This communication and its contents are for informational and educational purposes only and should not be used as the sole basis for any investment decision. The information contained herein is based on publicly available sources believed to be reliable but is not a representation, expressed or implied, as to the accuracy, completeness, or correctness of said information. Past performance does not guarantee future results.
">Rate-Casting
Note that the near-perfect long-term relationship between Treasury yields and Nominal GDP weakened over the past 20 years. What could have caused that distortion?
Over the past 20 years, the US Federal Reserve bought $8 trillion worth of bonds to intentionally suppress longer-term interest rates… to intentionally boost nominal GDP. This explains the gap between nominal GDP and Treasury rates. It was by design! That effort has now reversed, with the Fed selling $1 trillion worth of bonds over the past year to intentionally boost longer-term interest rates… to intentionally suppress nominal GDP. It is, therefore, no coincidence that long-term interest rates have doubled since the Fed’s bond sales began. It’s by design! For this reason, one could argue that, unlike the last 20 years when nominal GDP well exceeded the 10-year Treasury yield, the inverse could now occur where 10-year Treasury yields well exceed Nominal GDP. Maybe. But it’s highly unlikely that the Fed will continue to sell bonds for the next 20 years. Most observers expect the Fed to continue shrinking its balance sheet for another year or two, totaling between $1 trillion to $2 trillion in sales. With that being the case, the more traditional parity relationship between nominal GDP and the 10-year Treasury bond should reappear. Therefore, to correctly forecast long-term interest rates, we must properly forecast nominal GDP.
Forecasting longer-term economic growth isn’t actually that difficult. Economic growth depends on labor force growth and labor productivity growth. Labor force growth is easy to forecast as tomorrow’s workforce has already been born. Productivity forecasts provide a greater challenge but tend to average between 1-2% depending on innovation cycles. Based on the CBO’s estimate, here is what we can expect from inflation-adjusted GDP growth over the next ten-plus years:
The CBO’s 1.8% GDP growth estimate over the next decade could prove low if immigration levels rise and/or technological advances (such as AI) boost productivity. As an optimist and a believer in the power of AI, I will adjust this figure up to 2.2% for our purposes.
To finish our nominal GDP forecast we must properly estimate inflation. Here is a long-term look at CPI inflation trends. Note the historic spikes in inflation correlate with the fiscal and monetary policy mistakes of the 1970s and the unprecedented stimulus measures deployed during COVID:
Removing the inflation of the 1970’s and COVID era, long-term consumer price inflation since 1965 averages about 2.5%. The modern US Federal Reserve has adopted a 2% inflation target that it rebroadcasts every chance it gets. Based on their own forecast, inflation should return to 2% by 2026. According to the futures markets, inflation will run slightly higher, averaging its more traditional 2.5% over the next ten years. We tend to agree more with the markets than govies and will therefore add 2.5% inflation to our 2.2% GDP figure, deriving a nominal GDP estimate of 4.7% over the next ten years.
Using 4.7% as our baseline for nominal GDP growth allows us to baseline our 10-year treasury yield expectation at 4.7% as well. For those who want to raise that yield estimate for Fed bond sales over the next couple of years, tack on another .5%. This takes you to 5.2%. For those who want to raise the yield premium further for the potential of a ratings downgrade or Fed default over the next couple of years, tack on another .25%. This takes you to 5.5%. Barring some market catastrophe, 5.5% feels like a sensible upward bound. However, this 10-year forward analysis doesn’t help us forecast rates over the next quarter… but history offers near-term comfort here as well.
Last quarter (Q2), nominal GDP grew 3.8%. The 10-Year Treasury exited the quarter at 3.8% as well. The 10-Year Treasury currently yields 5%, suggesting a 5% nominal GDP growth rate for Q3. This is certainly possible as economic momentum has increased, but it’s highly unlikely to maintain that pace for subsequent quarters and represents a clear counter-trend:
The recent record on the path for interest rates after quarters where they exceeded nominal GDP growth rates is consistent. Either GDP rates rise (unlikely) or interest rates fall (likely). Therefore, as nominal GDP stabilizes under 5%, we expect interest rates will stabilize there as well.
Have a great week!
David S. Waddell
CEO, Chief Investment Strategist
Source: Fred Database, CBO
This communication and its contents are for informational and educational purposes only and should not be used as the sole basis for any investment decision. The information contained herein is based on publicly available sources believed to be reliable but is not a representation, expressed or implied, as to the accuracy, completeness, or correctness of said information. Past performance does not guarantee future results.
" class="link-chevron">
So far, so good. On Friday, JP Morgan, Wells Fargo, and Citigroup kicked off the season with upside surprises. Despite the apparent headwinds, combined, revenue for the three banks rose 14% over the past year. Funding costs have risen, the trio paying depositors 2.6% on average, but this remains well below prevailing lending rates.
Charge offs have also risen and credit card balances are rising, but management commentary conveyed consumer confidence and reduced “hard landing” expectations. Non-banks will dominate next week’s releases along with industrials which should lend further support. At the moment, analysts still suspect earnings will contract for the quarter, but with continued upside surprises, it will take very little to flip positive after three consecutive negative quarters. Note the pattern below of recent pleasant quarterly surprises:
What’s up with Inflation?
The September Consumer Price Inflation report released Wednesday received the brunt of the drawdown blame. We disagree. While headline and core inflation remain well above the Fed’s 2% target at 3.7% and 4.1% year over year, by removing lagging shelter inflation, both measures collapse to 2.0% on the nose. Shelter inflation rose 7.1% in September, but every other, more immediate measure shows rapid disinflation, if not deflation, in shelter expenses.
For anecdotal evidence, look up homes for sale in your neighborhood on Zillow and count up the price reductions. I am typing this week in Nashville where the Zillow Values Index reports Nashville values have fallen 2.6% over the past year. That’s a far cry from the 7% inflation tabulated by the Fed. This timing reality mismatch has not been lost on Fed officials. Numerous voting members have cited the current Fed Funds rate as sufficient. Accordingly, the Fed Funds futures market prices in a less than a 30% chance of another rate hike by year end. So, with inflation continuing its decent and Fed officials signaling peak Fed Funds, what does deserve this week’s drawdown blame?
Auction Malfunction
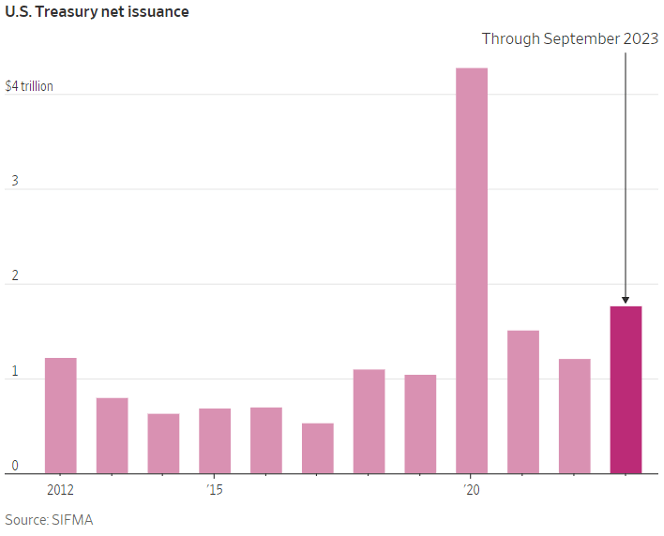
On Thursday, the US Treasury auction of $20 billion in 30-year bonds failed to generate enough investor demand. This led to a 0.12% surge higher in yields for the 30-year and a sympathetic surge 0.10% higher for the 10-year. Treasury demand shortfalls continue to be the markets’, and our own, primary concern moving forward. With inflation falling, longer-term rates should drift lower, but meager tax receipts and higher government spending continue to force rates higher as demand wanes. Note that the amount of Treasury issuance chronicled below through September already exceeds full year totals, outside of the 2020 stimulus surge:
Going forward, government deficit projections offer little comfort, and rising yields drive rising interest expenses in a compounding vicious cycle. Washington political histrionics also deter bidders, as Speaker shuffles and shutdown brinkmanship tempts ratings agencies to further cut our grade. Unfortunately, forecasting Government fiscal behavior, debt market absorption rates, and global central bank policy shifts simultaneously is nearly impossible, and particularly frustrating for this market strategist.
Fortunately, markets discount the future and the current levels in long term yields contain the knowledge of deficit ramps, interest rate burdens and policy frameworks. The 10-year yield did close the week at 4.63%, below its October 6th high of 4.89%, no doubt a contributor to this week’s rally for equities. As long as yields behave reasonably, earnings upside should drive equity market upside. I just wish public sector behavior was as readily forecastable as private sector behavior. Anyone with that crystal ball please contact me, immediately.
As we collectively process the horrific and heartbreaking events dominating the news cycle this past week, it is impossible to ignore the fear and anxiety that many in our communities are facing. The loss, grief, and apprehension for loved ones’ safety are profound. Our heartfelt sympathies and support are with our clients, team members, and friends, who may be experiencing the impacts of this deeply disturbing and tragic violence. We share in your grief and pray for the safe return of those who are missing.
David S. Waddell
CEO, Chief Investment Strategist
Source: FS Insights, FactSet, SIFMA
">Stumbling Out of the Rally Blocks
So far, so good. On Friday, JP Morgan, Wells Fargo, and Citigroup kicked off the season with upside surprises. Despite the apparent headwinds, combined, revenue for the three banks rose 14% over the past year. Funding costs have risen, the trio paying depositors 2.6% on average, but this remains well below prevailing lending rates.
Charge offs have also risen and credit card balances are rising, but management commentary conveyed consumer confidence and reduced “hard landing” expectations. Non-banks will dominate next week’s releases along with industrials which should lend further support. At the moment, analysts still suspect earnings will contract for the quarter, but with continued upside surprises, it will take very little to flip positive after three consecutive negative quarters. Note the pattern below of recent pleasant quarterly surprises:
What’s up with Inflation?
The September Consumer Price Inflation report released Wednesday received the brunt of the drawdown blame. We disagree. While headline and core inflation remain well above the Fed’s 2% target at 3.7% and 4.1% year over year, by removing lagging shelter inflation, both measures collapse to 2.0% on the nose. Shelter inflation rose 7.1% in September, but every other, more immediate measure shows rapid disinflation, if not deflation, in shelter expenses.
For anecdotal evidence, look up homes for sale in your neighborhood on Zillow and count up the price reductions. I am typing this week in Nashville where the Zillow Values Index reports Nashville values have fallen 2.6% over the past year. That’s a far cry from the 7% inflation tabulated by the Fed. This timing reality mismatch has not been lost on Fed officials. Numerous voting members have cited the current Fed Funds rate as sufficient. Accordingly, the Fed Funds futures market prices in a less than a 30% chance of another rate hike by year end. So, with inflation continuing its decent and Fed officials signaling peak Fed Funds, what does deserve this week’s drawdown blame?
Auction Malfunction
On Thursday, the US Treasury auction of $20 billion in 30-year bonds failed to generate enough investor demand. This led to a 0.12% surge higher in yields for the 30-year and a sympathetic surge 0.10% higher for the 10-year. Treasury demand shortfalls continue to be the markets’, and our own, primary concern moving forward. With inflation falling, longer-term rates should drift lower, but meager tax receipts and higher government spending continue to force rates higher as demand wanes. Note that the amount of Treasury issuance chronicled below through September already exceeds full year totals, outside of the 2020 stimulus surge:
Going forward, government deficit projections offer little comfort, and rising yields drive rising interest expenses in a compounding vicious cycle. Washington political histrionics also deter bidders, as Speaker shuffles and shutdown brinkmanship tempts ratings agencies to further cut our grade. Unfortunately, forecasting Government fiscal behavior, debt market absorption rates, and global central bank policy shifts simultaneously is nearly impossible, and particularly frustrating for this market strategist.
Fortunately, markets discount the future and the current levels in long term yields contain the knowledge of deficit ramps, interest rate burdens and policy frameworks. The 10-year yield did close the week at 4.63%, below its October 6th high of 4.89%, no doubt a contributor to this week’s rally for equities. As long as yields behave reasonably, earnings upside should drive equity market upside. I just wish public sector behavior was as readily forecastable as private sector behavior. Anyone with that crystal ball please contact me, immediately.
As we collectively process the horrific and heartbreaking events dominating the news cycle this past week, it is impossible to ignore the fear and anxiety that many in our communities are facing. The loss, grief, and apprehension for loved ones’ safety are profound. Our heartfelt sympathies and support are with our clients, team members, and friends, who may be experiencing the impacts of this deeply disturbing and tragic violence. We share in your grief and pray for the safe return of those who are missing.
David S. Waddell
CEO, Chief Investment Strategist
Source: FS Insights, FactSet, SIFMA
" class="link-chevron">
For the upcoming quarter, analysts expect another, albeit slight, earnings decline. Based upon upside surprises over the past few quarters, we expect the final tally for this quarter will result in positive earnings growth. If that’s the case, this will be the first positive report in a year!
For the fourth quarter, analysts currently forecast an 8% earnings growth rate. For 2024, analysts forecast a 12% growth rate. Many doubt these figures for a myriad of reasons, but if you squint at the visual above, earnings transitions from negative to positive tend to unlock outsized upside.
The Dow rallied 300 points on Friday. The September labor report detailed 366,000 payrolls added last month versus the 170,000 anticipated. Continued labor market strength translates into continued consumer spending strength which translates into continued economic strength and therefore, earnings strength. This report only increased the odds of a positive third quarter earnings season.
P/E is for Valuations
Currently, the S&P 500 trades for approximately 18x estimated earnings. If we compare this level with long-run averages, the current valuation appears stretched:

Clearly, however, valuations vacillate. The runup in valuations from 1980 to 2000 (8 to 25) provided an enormous tailwind for S&P 500 investors. Likewise, the fall in valuations from 2000 to 2010 (25 to 12) provided an enormous headwind for investors. Investors gained 18% annually through the 1980’s and 18% annually through the 1990’s. In the 2000’s investor returns dropped to -1% annually.
Clearly, valuation trends matter (it’s math). Currently, the S&P 500 valuation trend better resembles the sideways chop of the 1960’s. Over the decade of the 1960’s, the S&P provided investors with returns of 8%, reliant on earnings growth and dividend yields for lift, as seen below:

Larger directional trends in valuation stem from larger directional trends in interest rates. As bond yields fall, equity valuations rise to maintain equilibrium between the two asset classes, and vice versa. Note that in the chart above, the trend upward in rates through the 60’s and 70’s corresponded with lower total returns for stock investors, while the trend downward in rates through the 80’s and 90’s corresponded with higher returns.
Interest rate calculations include forecasts for inflation, creditworthiness, Central Bank policy and marketplace liquidity. In other words, it’s complicated. However, in our current environment, any reports of disinflation or Federal Reserve policy downshifts places downforce on interest rates and therefore upforce on valuations.
The September labor report showed a continued glidepath lower for wages, with average hourly earnings rising 4.1% over the past year—only 3.4% when using a 3-month rolling average. The Fed wants wage growth of around 3%, bringing the target within range.
Continued wage disinflation supports continued disinflation overall, reducing pressure on the Fed to do more, and reducing pressure on long-term interest rates. As such, this report added upward pressure on P/E and improved the odds that valuations need not fall further into year-end.
Paging Mr. Claus
Taken together, with earnings gaining positive momentum starting October 13th and interest rates potentially stalling out at these levels (dependent upon the upcoming CPI inflation report on October 12), markets now appear anxious to rally into year-end.
The one pre-condition we set for the start was a sentiment decline down to 25% bulls. We didn’t get there. We got down to 27.8% at the end of last week. However, when the market fell 270 points early Friday morning, I heard a bearish strategist on CNBC declare, “Everyone is afraid of everything right now!” and felt that our sentiment correction call seemed well-enough fulfilled. We must clear the CPI report first, but should that arrive benign, it’s time to cue the Claus.
Have a great weekend!
David S. Waddell
CEO, Chief Investment Strategist
Source: Yardeni
">A Look-See into E and P/E
For the upcoming quarter, analysts expect another, albeit slight, earnings decline. Based upon upside surprises over the past few quarters, we expect the final tally for this quarter will result in positive earnings growth. If that’s the case, this will be the first positive report in a year!
For the fourth quarter, analysts currently forecast an 8% earnings growth rate. For 2024, analysts forecast a 12% growth rate. Many doubt these figures for a myriad of reasons, but if you squint at the visual above, earnings transitions from negative to positive tend to unlock outsized upside.
The Dow rallied 300 points on Friday. The September labor report detailed 366,000 payrolls added last month versus the 170,000 anticipated. Continued labor market strength translates into continued consumer spending strength which translates into continued economic strength and therefore, earnings strength. This report only increased the odds of a positive third quarter earnings season.
P/E is for Valuations
Currently, the S&P 500 trades for approximately 18x estimated earnings. If we compare this level with long-run averages, the current valuation appears stretched:
Clearly, however, valuations vacillate. The runup in valuations from 1980 to 2000 (8 to 25) provided an enormous tailwind for S&P 500 investors. Likewise, the fall in valuations from 2000 to 2010 (25 to 12) provided an enormous headwind for investors. Investors gained 18% annually through the 1980’s and 18% annually through the 1990’s. In the 2000’s investor returns dropped to -1% annually.
Clearly, valuation trends matter (it’s math). Currently, the S&P 500 valuation trend better resembles the sideways chop of the 1960’s. Over the decade of the 1960’s, the S&P provided investors with returns of 8%, reliant on earnings growth and dividend yields for lift, as seen below:
Larger directional trends in valuation stem from larger directional trends in interest rates. As bond yields fall, equity valuations rise to maintain equilibrium between the two asset classes, and vice versa. Note that in the chart above, the trend upward in rates through the 60’s and 70’s corresponded with lower total returns for stock investors, while the trend downward in rates through the 80’s and 90’s corresponded with higher returns.
Interest rate calculations include forecasts for inflation, creditworthiness, Central Bank policy and marketplace liquidity. In other words, it’s complicated. However, in our current environment, any reports of disinflation or Federal Reserve policy downshifts places downforce on interest rates and therefore upforce on valuations.
The September labor report showed a continued glidepath lower for wages, with average hourly earnings rising 4.1% over the past year—only 3.4% when using a 3-month rolling average. The Fed wants wage growth of around 3%, bringing the target within range.
Continued wage disinflation supports continued disinflation overall, reducing pressure on the Fed to do more, and reducing pressure on long-term interest rates. As such, this report added upward pressure on P/E and improved the odds that valuations need not fall further into year-end.
Paging Mr. Claus
Taken together, with earnings gaining positive momentum starting October 13th and interest rates potentially stalling out at these levels (dependent upon the upcoming CPI inflation report on October 12), markets now appear anxious to rally into year-end.
The one pre-condition we set for the start was a sentiment decline down to 25% bulls. We didn’t get there. We got down to 27.8% at the end of last week. However, when the market fell 270 points early Friday morning, I heard a bearish strategist on CNBC declare, “Everyone is afraid of everything right now!” and felt that our sentiment correction call seemed well-enough fulfilled. We must clear the CPI report first, but should that arrive benign, it’s time to cue the Claus.
Have a great weekend!
David S. Waddell
CEO, Chief Investment Strategist
Source: Yardeni
" class="link-chevron">
We remain in a sentiment and seasonally driven drawdown period until further notice. Given the importance retail investors place on Government histrionics, the upcoming shutdown shenanigans might just punctuate this sentiment correction. Offering support for our viewpoint, interest rates, oil, and the US dollar have shot sharply higher in September while the S&P has shed less than 4%, and we remain only 6% beneath the July highs. If the worry beads of an oil shock, rate shock, currency shock, government shutdown, and the UAW strike have only managed to knock this market down 6%, there must be more momentum and resiliency in this economy than suspected. We agree. And that’s what the Fed said.
Summarizing the Fed’s Summary
Each quarter, the Fed releases a summary of economic projections. This report anonymously details each of the 17 FOMC members’ outlooks on GDP, unemployment, inflation, and interest rates. The table below contains the details for the meticulous. For the rest of you, don’t grab your readers; I will highlight what’s important underneath:
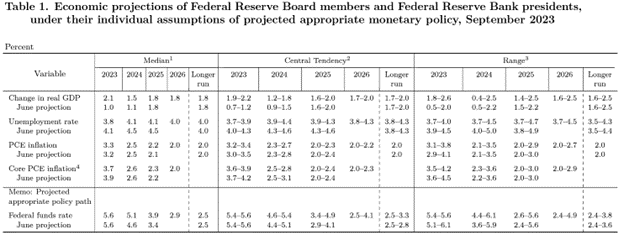
Let’s start with GDP. In June, the Fed expected full-year economic growth of 1% for 2023 and 1.1% for 2024. Now they expect 2.1% for 2023 and 1.5% for 2024. That’s a 100% upgrade in their view for this year and a 50% upgrade for next year. Wow!
For unemployment, the Fed projected a 4.1% rate at year-end and a 4.5% rate at year-end 2024, down from 4.1% and 4.5%, respectively. Great!
On inflation, the Fed projected a reduction in core PCE inflation from 3.9% to 3.7% for 2023, and 2.6% to 2.6% for 2024. Outstanding!
So, according to the Fed, the economy will be stronger than expected, unemployment less than expected, and inflation marginally less. Yahtzee! A more resilient and robust economy should carry a higher interest rate regime.
The Fed’s projection for their own policy rate remained 5.6% for this year but rose from 4.6% to 5.1% next year and from 3.4% to 3.9% in 2025. On this point, the market panicked, focusing on the higher rate regime rather than the robust economics. This “Ready, Fire, Aim” reaction was fine by us as the misread suppresses sentiment further despite the Fed’s confirmation of strengthening fundamentals. In his comments, Powell cautioned Fed watchers to treat these quarterly future casts as guesses, not plans. He reiterated his focus on the monthly CPI inflation and unemployment reports to direct policy, and paid no attention to the SEP as a policy tool. The September Employment Report arrives October 6th, and the September CPI report arrives October 12th–right about the time we expect sentiment to bottom.
Have a great weekend!
David S. Waddell
CEO, Chief Investment Strategist
Source: YCharts, W&A Presentation
">Mr. Market, We Respectfully and Gleefully Disagree!
We remain in a sentiment and seasonally driven drawdown period until further notice. Given the importance retail investors place on Government histrionics, the upcoming shutdown shenanigans might just punctuate this sentiment correction. Offering support for our viewpoint, interest rates, oil, and the US dollar have shot sharply higher in September while the S&P has shed less than 4%, and we remain only 6% beneath the July highs. If the worry beads of an oil shock, rate shock, currency shock, government shutdown, and the UAW strike have only managed to knock this market down 6%, there must be more momentum and resiliency in this economy than suspected. We agree. And that’s what the Fed said.
Summarizing the Fed’s Summary
Each quarter, the Fed releases a summary of economic projections. This report anonymously details each of the 17 FOMC members’ outlooks on GDP, unemployment, inflation, and interest rates. The table below contains the details for the meticulous. For the rest of you, don’t grab your readers; I will highlight what’s important underneath:
Let’s start with GDP. In June, the Fed expected full-year economic growth of 1% for 2023 and 1.1% for 2024. Now they expect 2.1% for 2023 and 1.5% for 2024. That’s a 100% upgrade in their view for this year and a 50% upgrade for next year. Wow!
For unemployment, the Fed projected a 4.1% rate at year-end and a 4.5% rate at year-end 2024, down from 4.1% and 4.5%, respectively. Great!
On inflation, the Fed projected a reduction in core PCE inflation from 3.9% to 3.7% for 2023, and 2.6% to 2.6% for 2024. Outstanding!
So, according to the Fed, the economy will be stronger than expected, unemployment less than expected, and inflation marginally less. Yahtzee! A more resilient and robust economy should carry a higher interest rate regime.
The Fed’s projection for their own policy rate remained 5.6% for this year but rose from 4.6% to 5.1% next year and from 3.4% to 3.9% in 2025. On this point, the market panicked, focusing on the higher rate regime rather than the robust economics. This “Ready, Fire, Aim” reaction was fine by us as the misread suppresses sentiment further despite the Fed’s confirmation of strengthening fundamentals. In his comments, Powell cautioned Fed watchers to treat these quarterly future casts as guesses, not plans. He reiterated his focus on the monthly CPI inflation and unemployment reports to direct policy, and paid no attention to the SEP as a policy tool. The September Employment Report arrives October 6th, and the September CPI report arrives October 12th–right about the time we expect sentiment to bottom.
Have a great weekend!
David S. Waddell
CEO, Chief Investment Strategist
Source: YCharts, W&A Presentation
" class="link-chevron">
Note that the average intra-year retreat is 14%. However, this average gets skewed by some large outliers like 2008. If we take the median rather than the average to reduce the skew, the average intra-year retreat falls to 10%. For 2023, we hit our first intra-year peak on February 2nd at 4179 on the S&P. The index then retreated 8% into the March lows and didn’t recover the February highs until May 18th. In total, that 8% pullback lasted 105 days.
From there, support from economic resilience, earnings surprises, and accelerating disinflation provided the uplift to reach another intra-year high of 4588 on July 31st. Unfortunately, stocks 20% higher mid-year led to investor overconfidence and bullishness reached threatening levels. Stressors emerged to challenge the complacent consensus. Interest rates, the dollar, and oil prices rose. Chinese and European economic momentum fell. Politics became more bellicose, and even our old foe, COVID, reemerged. From the July highs, the S&P fell 5.5%. Currently, we sit 3% below the July peak. We are now 41 days into this pullback period.
Should this pullback achieve average depth and duration, we would bottom out near 4150 (the 200-day moving average) somewhere near mid-October. For reference, we closed the week at 4440. This is not a prediction, but it is well within the range of typical pullback behavior. We do not anticipate an accompanying deterioration in disinflation, economic, or earnings growth, rendering this a psychological retreat rather than a fundamental retreat. Therefore, investors should focus on sentiment levels rather than market levels for orientation. Here are our indicators of the moment and the thresholds we would like to see met:


Investor bullishness falling below 25% and/or negative readings for the Citigroup Economic Surprise index would position reality to begin exceeding expectations once again, a durable precondition for further gains. Earnings tailwinds will then add a fundamental boost as disinflation powers profit margins–making 2024 a much more fundamental and much less sentiment-driven market.
Have a great weekend!
David S. Waddell
CEO, Chief Investment Strategist
Source: Citigroup, YCharts, Factset, Standard and Poor’s, JP morgan Asset Management
">Pullback Plays
Note that the average intra-year retreat is 14%. However, this average gets skewed by some large outliers like 2008. If we take the median rather than the average to reduce the skew, the average intra-year retreat falls to 10%. For 2023, we hit our first intra-year peak on February 2nd at 4179 on the S&P. The index then retreated 8% into the March lows and didn’t recover the February highs until May 18th. In total, that 8% pullback lasted 105 days.
From there, support from economic resilience, earnings surprises, and accelerating disinflation provided the uplift to reach another intra-year high of 4588 on July 31st. Unfortunately, stocks 20% higher mid-year led to investor overconfidence and bullishness reached threatening levels. Stressors emerged to challenge the complacent consensus. Interest rates, the dollar, and oil prices rose. Chinese and European economic momentum fell. Politics became more bellicose, and even our old foe, COVID, reemerged. From the July highs, the S&P fell 5.5%. Currently, we sit 3% below the July peak. We are now 41 days into this pullback period.
Should this pullback achieve average depth and duration, we would bottom out near 4150 (the 200-day moving average) somewhere near mid-October. For reference, we closed the week at 4440. This is not a prediction, but it is well within the range of typical pullback behavior. We do not anticipate an accompanying deterioration in disinflation, economic, or earnings growth, rendering this a psychological retreat rather than a fundamental retreat. Therefore, investors should focus on sentiment levels rather than market levels for orientation. Here are our indicators of the moment and the thresholds we would like to see met:
Investor bullishness falling below 25% and/or negative readings for the Citigroup Economic Surprise index would position reality to begin exceeding expectations once again, a durable precondition for further gains. Earnings tailwinds will then add a fundamental boost as disinflation powers profit margins–making 2024 a much more fundamental and much less sentiment-driven market.
Have a great weekend!
David S. Waddell
CEO, Chief Investment Strategist
Source: Citigroup, YCharts, Factset, Standard and Poor’s, JP morgan Asset Management
" class="link-chevron">
Easing Labor Pains
While the disinflation trend pleases the Fed, they have expressed displeasure with the continuing strength of the labor market. This week, we received lots of labor data to interpret before the Fed’s next rate decision date in 17 days. The Job Openings and Turnover Survey release provided encouraging data depicting a decelerating jobs market. Job openings fell to 8.8 million in July after peaking at 12 million in March of 2022, while the US labor force has ticked higher to cycle highs. This increase in labor supply and decrease in labor demand provides trend reassurance for the Fed:
As the demand and supply for workers pursue pre-COVID equilibrium, wage pressures and inflation pressures should further ease. On Friday, the Department of Labor released its monthly jobs report. In August, employers added 187,000 workers to the payroll, while the unemployment rate ticked higher from 3.5% to 3.8%. A surge higher in labor force participation accounts for the higher unemployment rate despite job gains as COVID savings diminish and student loan payments resume.
While the increase in supply is encouraging, the increase in demand may be overstated. Each labor report contains job count revisions to previous reports. These revisions can increase or decrease counts significantly. Note the revision trends so far for 2023:
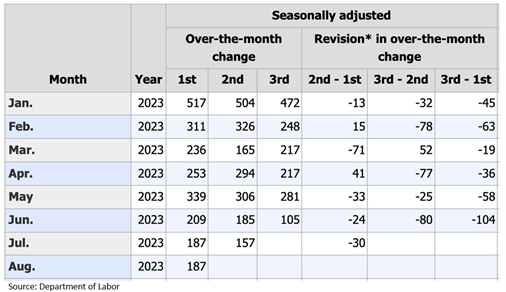
Every month of 2023 has seen downward revisions in payroll counts. For instance, the 209,000 job gains first reported for June have been revised lower by 104,000 jobs to 105,000. Therefore, while the headline job gains for August slightly exceeded expectations, the uptick in participation and the downward revision trends express Fed-friendly labor market weakness beneath the fold.
According to the futures markets, the odds of a September rate hike have fallen to 7%. While September typically provides investors with losses, neutral sentiment, persistent economic growth, disinflation trends, and labor market rebalancing may stoke a September surprise.
Have a fantastic holiday weekend!
David S. Waddell
CEO, Chief Investment Strategist
Source: Department of Labor, YCharts, yardeni.com
">Rally Revenge!
Easing Labor Pains
While the disinflation trend pleases the Fed, they have expressed displeasure with the continuing strength of the labor market. This week, we received lots of labor data to interpret before the Fed’s next rate decision date in 17 days. The Job Openings and Turnover Survey release provided encouraging data depicting a decelerating jobs market. Job openings fell to 8.8 million in July after peaking at 12 million in March of 2022, while the US labor force has ticked higher to cycle highs. This increase in labor supply and decrease in labor demand provides trend reassurance for the Fed:
As the demand and supply for workers pursue pre-COVID equilibrium, wage pressures and inflation pressures should further ease. On Friday, the Department of Labor released its monthly jobs report. In August, employers added 187,000 workers to the payroll, while the unemployment rate ticked higher from 3.5% to 3.8%. A surge higher in labor force participation accounts for the higher unemployment rate despite job gains as COVID savings diminish and student loan payments resume.
While the increase in supply is encouraging, the increase in demand may be overstated. Each labor report contains job count revisions to previous reports. These revisions can increase or decrease counts significantly. Note the revision trends so far for 2023:
Every month of 2023 has seen downward revisions in payroll counts. For instance, the 209,000 job gains first reported for June have been revised lower by 104,000 jobs to 105,000. Therefore, while the headline job gains for August slightly exceeded expectations, the uptick in participation and the downward revision trends express Fed-friendly labor market weakness beneath the fold.
According to the futures markets, the odds of a September rate hike have fallen to 7%. While September typically provides investors with losses, neutral sentiment, persistent economic growth, disinflation trends, and labor market rebalancing may stoke a September surprise.
Have a fantastic holiday weekend!
David S. Waddell
CEO, Chief Investment Strategist
Source: Department of Labor, YCharts, yardeni.com
" class="link-chevron">
Last year at Jackson Hole, Jerome Powell verbally slammed the brakes on monetary policy. He forecast “pain” for economic participants, promoting recession as the antidote for inflation. Over the next year, the Fed increased rates from 2.5% to 5.5% and shrank their balance sheet by $700 billion. Inflation fell from 8.5% to 3.5% over that timeframe while GDP grew 2.6%. Contrary to Powell’s comments last year, recession wasn’t required to reduce inflation. Therefore, hiking rates further only poses risks to the banking system and economy without clear reward. Should Powell double down on tough talk now and support higher rates to ice inflation, or should Powell try and relieve some of the rate stress plaguing the financial system given inflation’s downward bias? On Friday, Chairman Powell took the microphone at Jackson Hole once again. Here is what he said:
“I Get It”
Powell struck a largely neutral tone. He committed to a 2% inflation target and suggested more inflation would require more austerity. This satisfied the hawks. However, he also acknowledged that monetary policy has reached restrictive levels. Furthermore, he acknowledged that REAL interest rates (rates minus inflation) have risen dramatically with inflation falling.
The rise in REAL interest rates amounts to organic monetary tightening, reducing the need for policy tightening from the Fed. He referred to the auto and goods sectors as examples of rising supply levels driving desired disinflation while also citing a helping hand from falling rents. My read, Powell sees disinflation as more likely than reinflation. The data will have to prove him wrong, which is a much more constructive bias for the markets than the inverse.
On the economy, Powell recognized the reduction in lending and bank credit, and the connection between slowing credit trends and slowing economic trends. He did not suggest that recent rate increases have increased systematic risks, which made him seem willing to tolerate current yield levels.
In all, Powell pacified both market hawks and doves with his neutral stance. This was the right strategy. However, by our interpretation, Powell now sees disinflation as more likely than reinflation. He recognizes that rising real rates will suppress demand further and he acknowledges that monetary drag filters through the economy with a lag. This all reduces incentive for further tightening… unless upcoming data proves overwhelmingly otherwise. In short, Powell gets it.
We will receive July PCE data on August 31st and August CPI data on September 13th. The Fed meets again on September 20th. The market currently places odds of no hike at 80%. On this, we can agree.
Have a fantastic weekend!
David S. Waddell
CEO, Chief Investment Strategist
Source: FRED Database
">Powell’s Play
Last year at Jackson Hole, Jerome Powell verbally slammed the brakes on monetary policy. He forecast “pain” for economic participants, promoting recession as the antidote for inflation. Over the next year, the Fed increased rates from 2.5% to 5.5% and shrank their balance sheet by $700 billion. Inflation fell from 8.5% to 3.5% over that timeframe while GDP grew 2.6%. Contrary to Powell’s comments last year, recession wasn’t required to reduce inflation. Therefore, hiking rates further only poses risks to the banking system and economy without clear reward. Should Powell double down on tough talk now and support higher rates to ice inflation, or should Powell try and relieve some of the rate stress plaguing the financial system given inflation’s downward bias? On Friday, Chairman Powell took the microphone at Jackson Hole once again. Here is what he said:
“I Get It”
Powell struck a largely neutral tone. He committed to a 2% inflation target and suggested more inflation would require more austerity. This satisfied the hawks. However, he also acknowledged that monetary policy has reached restrictive levels. Furthermore, he acknowledged that REAL interest rates (rates minus inflation) have risen dramatically with inflation falling.
The rise in REAL interest rates amounts to organic monetary tightening, reducing the need for policy tightening from the Fed. He referred to the auto and goods sectors as examples of rising supply levels driving desired disinflation while also citing a helping hand from falling rents. My read, Powell sees disinflation as more likely than reinflation. The data will have to prove him wrong, which is a much more constructive bias for the markets than the inverse.
On the economy, Powell recognized the reduction in lending and bank credit, and the connection between slowing credit trends and slowing economic trends. He did not suggest that recent rate increases have increased systematic risks, which made him seem willing to tolerate current yield levels.
In all, Powell pacified both market hawks and doves with his neutral stance. This was the right strategy. However, by our interpretation, Powell now sees disinflation as more likely than reinflation. He recognizes that rising real rates will suppress demand further and he acknowledges that monetary drag filters through the economy with a lag. This all reduces incentive for further tightening… unless upcoming data proves overwhelmingly otherwise. In short, Powell gets it.
We will receive July PCE data on August 31st and August CPI data on September 13th. The Fed meets again on September 20th. The market currently places odds of no hike at 80%. On this, we can agree.
Have a fantastic weekend!
David S. Waddell
CEO, Chief Investment Strategist
Source: FRED Database
" class="link-chevron">
After a relentless rally to begin the year, markets were certainly due for a seasonal sell-off. History may not repeat for markets, but it does tend to bio-rhyme.
Sentiment Softness
As Buffet famously quipped, “In the short run, the market is a voting machine, but in the long term, it acts like a weighing machine.” Frankly, it’s relatively easy to predict where the market will be 20 years from now and nearly impossible to predict where it will be 20 minutes from now, as the chart below demonstrates:
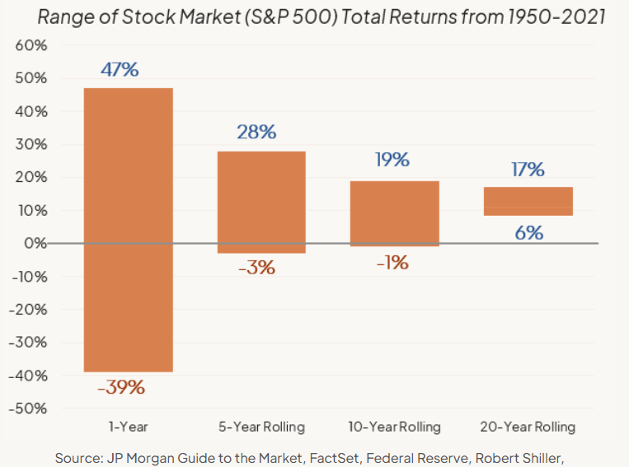
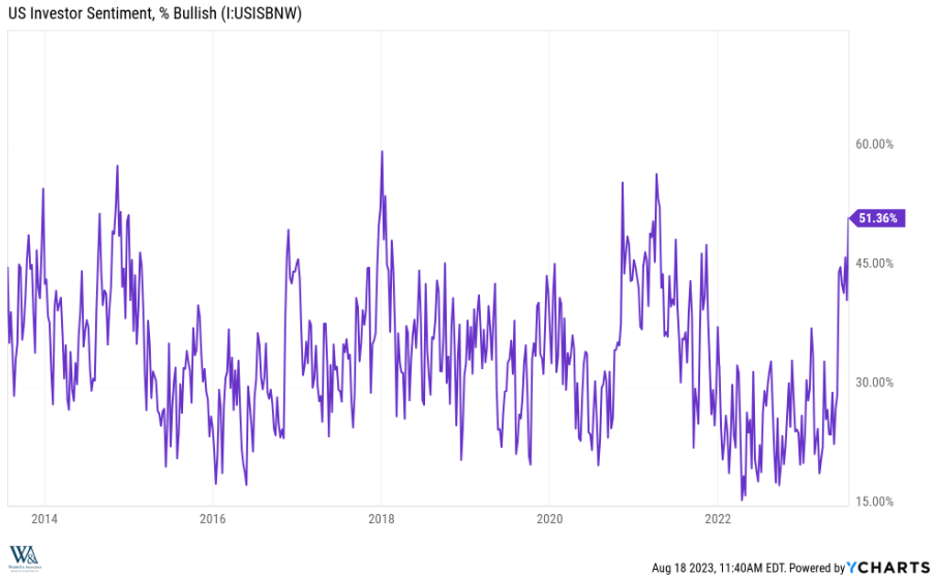
Therefore, within shorter timeframes, psychology and sentiment drive direction. We become very bullish whenever the number of retail investor bulls (those who think the market will rise over the next six months) drops below 20%… as they did towards the end of 2022. This helped fortify our optimism for 2023. Unfortunately, the opposite holds true as well. When investors become overly bullish, the market tends to struggle until sentiment corrects. As we noted in our halftime report, investor sentiment recovered strongly in the first half as inflation surprised to the downside and economic growth surprised to the upside. With that and the added AI hype, people began feeling far too optimistic for the market to follow:
With seasonal softness and a sentiment reset on order, the stock market became a balloon in search of a pin as we entered August.
The Pin That Provides
Just as sentiment peaked in late July, long-term Treasury interest rates began a relentless run higher to cycle highs. The market did not anticipate this surge higher in yields as inflation readings continue to arrive below expectations. However, it’s important to separate the behavior of short-term bond yields that are more sensitive to economic releases and Fed policy proclamations, and long-term bond yields that depend more on supply and demand dynamics. While the 10-year treasury yield has spiked .53% over the past three weeks, the 2-year treasury yield has only spiked .20%. Additionally, the futures market probabilities of a Fed rate hike in September and November continue to be low and haven’t changed while interest rates have risen. So, what’s driving rates higher?
Annualized Federal Government receipts (taxes) have fallen from a peak of $5.1 trillion mid-2022 to $4.7 trillion. Simultaneously, annualized Federal spending has increased from $5.8 trillion to $6.5 trillion. Currently, the CBO estimates a budget deficit of 6% of GDP compared with 5% last year. In other words, tax revenues at 18% of GDP cannot fund government spending at 24% of GDP, which forces the US Treasury to auction LOTS of Treasury bonds.
Unfortunately, the US Treasury isn’t the only institution selling Treasury bonds right now. Remember that the US Federal Reserve has an automated sell-off/roll-off program approximating $100 Billion a month it calls, “quantitative tightening”. Additionally, the Japanese central bank has allowed domestic interest rates to drift higher, removing some domestic incentives to yield seek abroad. The Chinese have also intervened in their currency market by selling dollars (housed in Treasuries) to buy yuan.
On the demand side, banks have become more reticent to stockpile longer-dated maturities after the “duration” failures of SVB and First Republic. Further denting confidence, Fitch downgraded US Treasuries from AAA to AA+ citing political dysfunction. On that note, Government shutdown theatrics could soon resume. A reluctant House has until October 1st to pass 12 appropriations bills. In short, the supply/demand imbalance for Treasuries has led to sharply higher yields, fostering immediate downward pressure on stock market valuations…
…providing the perfect pin to deflate inflated investor sentiment.
Structural vs. Seasonal
While recession fears have receded, inflation fears have not resurged. In fact, most economists and rate forecasters expect the next Fed policy move will be to lower rates sometime in early 2024. Inflation break-evens also remain subdued, reinforcing our belief that the surge in rates relates to the surge in supply, not a surge in re-inflation angst. Second quarter corporate earnings season surprised to the upside as expected, and things should get much more constructive from here:
As such, we do not view this as a structural breakdown, but rather a seasonal drawdown required to reset sentiment and refuel the rally into year-end.
Enjoy your weekend!
David S. Waddell
CEO, Chief Investment Strategist
Sources: I/B/E/S data from Refinitiv, Standard & Poor’s, Haver Analytics, JP Morgan, Federal Reserve, Robert Shiller, YCharts, US Department of Treasury, FactSet, Goldman Sachs
">Summer’s Bummers
After a relentless rally to begin the year, markets were certainly due for a seasonal sell-off. History may not repeat for markets, but it does tend to bio-rhyme.
Sentiment Softness
As Buffet famously quipped, “In the short run, the market is a voting machine, but in the long term, it acts like a weighing machine.” Frankly, it’s relatively easy to predict where the market will be 20 years from now and nearly impossible to predict where it will be 20 minutes from now, as the chart below demonstrates:
Therefore, within shorter timeframes, psychology and sentiment drive direction. We become very bullish whenever the number of retail investor bulls (those who think the market will rise over the next six months) drops below 20%… as they did towards the end of 2022. This helped fortify our optimism for 2023. Unfortunately, the opposite holds true as well. When investors become overly bullish, the market tends to struggle until sentiment corrects. As we noted in our halftime report, investor sentiment recovered strongly in the first half as inflation surprised to the downside and economic growth surprised to the upside. With that and the added AI hype, people began feeling far too optimistic for the market to follow:
With seasonal softness and a sentiment reset on order, the stock market became a balloon in search of a pin as we entered August.
The Pin That Provides
Just as sentiment peaked in late July, long-term Treasury interest rates began a relentless run higher to cycle highs. The market did not anticipate this surge higher in yields as inflation readings continue to arrive below expectations. However, it’s important to separate the behavior of short-term bond yields that are more sensitive to economic releases and Fed policy proclamations, and long-term bond yields that depend more on supply and demand dynamics. While the 10-year treasury yield has spiked .53% over the past three weeks, the 2-year treasury yield has only spiked .20%. Additionally, the futures market probabilities of a Fed rate hike in September and November continue to be low and haven’t changed while interest rates have risen. So, what’s driving rates higher?
Annualized Federal Government receipts (taxes) have fallen from a peak of $5.1 trillion mid-2022 to $4.7 trillion. Simultaneously, annualized Federal spending has increased from $5.8 trillion to $6.5 trillion. Currently, the CBO estimates a budget deficit of 6% of GDP compared with 5% last year. In other words, tax revenues at 18% of GDP cannot fund government spending at 24% of GDP, which forces the US Treasury to auction LOTS of Treasury bonds.
Unfortunately, the US Treasury isn’t the only institution selling Treasury bonds right now. Remember that the US Federal Reserve has an automated sell-off/roll-off program approximating $100 Billion a month it calls, “quantitative tightening”. Additionally, the Japanese central bank has allowed domestic interest rates to drift higher, removing some domestic incentives to yield seek abroad. The Chinese have also intervened in their currency market by selling dollars (housed in Treasuries) to buy yuan.
On the demand side, banks have become more reticent to stockpile longer-dated maturities after the “duration” failures of SVB and First Republic. Further denting confidence, Fitch downgraded US Treasuries from AAA to AA+ citing political dysfunction. On that note, Government shutdown theatrics could soon resume. A reluctant House has until October 1st to pass 12 appropriations bills. In short, the supply/demand imbalance for Treasuries has led to sharply higher yields, fostering immediate downward pressure on stock market valuations…
…providing the perfect pin to deflate inflated investor sentiment.
Structural vs. Seasonal
While recession fears have receded, inflation fears have not resurged. In fact, most economists and rate forecasters expect the next Fed policy move will be to lower rates sometime in early 2024. Inflation break-evens also remain subdued, reinforcing our belief that the surge in rates relates to the surge in supply, not a surge in re-inflation angst. Second quarter corporate earnings season surprised to the upside as expected, and things should get much more constructive from here:
As such, we do not view this as a structural breakdown, but rather a seasonal drawdown required to reset sentiment and refuel the rally into year-end.
Enjoy your weekend!
David S. Waddell
CEO, Chief Investment Strategist