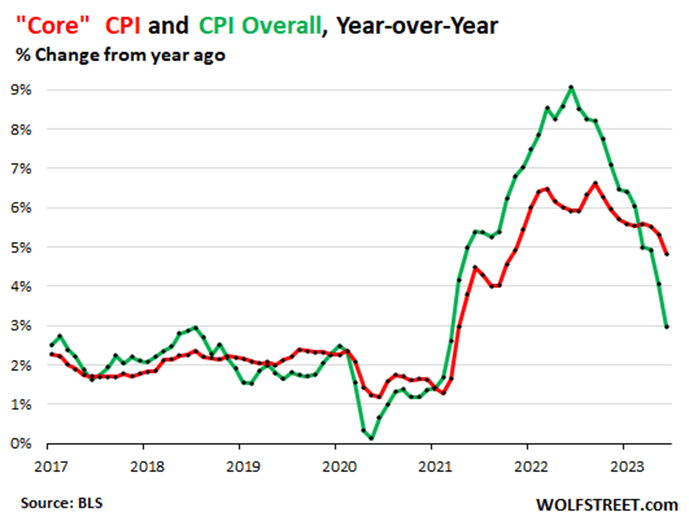
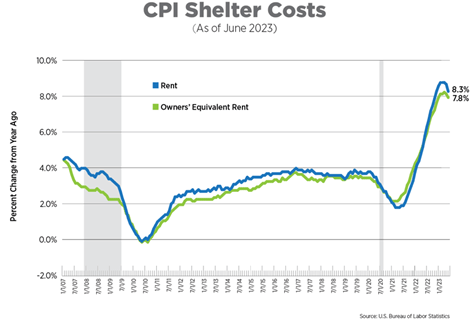
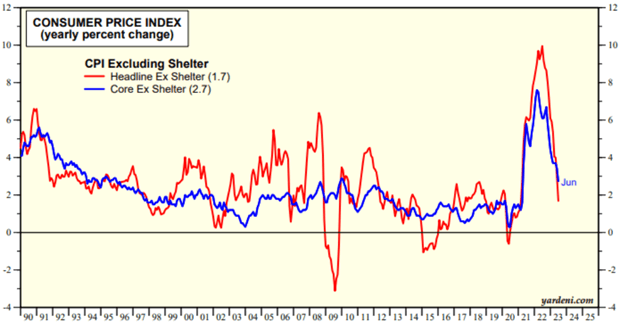
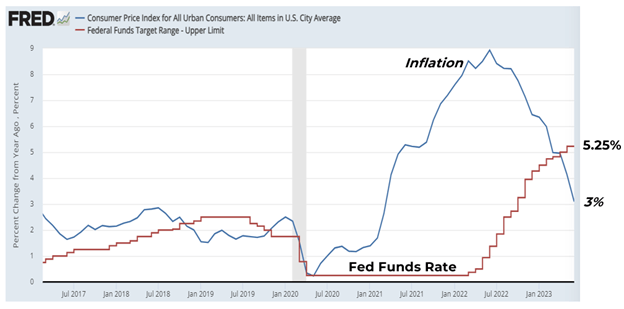
Within the CPI report, housing-related inflation ticked slightly lower but remains 8% higher than year-ago levels. Given the outsized role of shelter within CPI, the vast majority of inflation within the report was housing related. In fact, if you strip out housing, headline inflation falls to 1.7%, and core inflation falls to 2.7%, well within the Fed’s target range. This chart depicts just how dramatically overall inflation has risen and fallen when excluding shelter inflation:
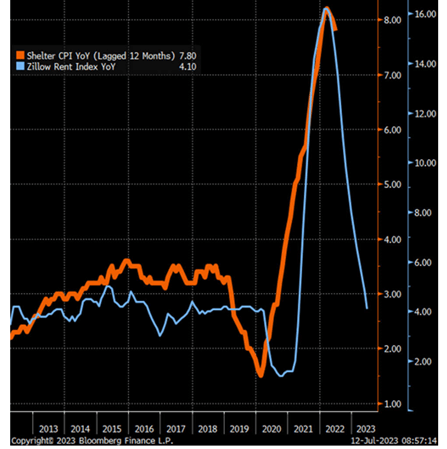
To further illustrate the rapid fall in price levels afoot, 45% of the items measured in June experienced outright deflation! With shelter sheltering inflation, when will these levels leg lower? Unfortunately, shelter inflation calculations in the CPI report arrive with considerable lags. Considering that the three-month rolling average shelter inflation rate is 6% and the June monthly rate annualizes at 4.4%, shelter inflation could fall more quickly than anticipated. Economists often reference more real-time gauges of shelter inflation like the Zillow Rent Index. Some have observed that the Zillow index tends to front-run the CPI shelter index by about one year. The Zillow index peaked early last year and recently reported rent inflation of 4% in June. The following chart harmonizes the two inflation indices and adjusts for the 12-month lag:
Well, isn’t that encouraging?!
If these proportions hold, shelter inflation within the Consumer Price Index could return to the Fed’s target levels within 12 months. With shelter’s outsized influence, shelter disinflation means deflating recession conviction at the Fed. Furthermore, stocks historically return three times more for investors when CPI falls than when it rises.
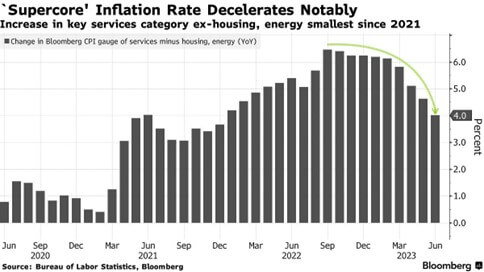
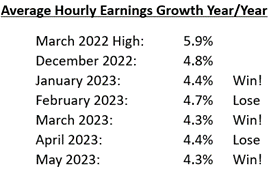
So, will this report keep the Fed at bay? Likely not. They have set expectations that they will raise rates another .25% on July 26th. Powell will undoubtedly site elevated wage inflation and “supercore” inflation that remains well above the 2% target. But even that fallback measure has lost momentum, as seen below:
In sum, we expect one more face-saving hike from the Fed with empty threats of doing more. Remember, while the Fed may have a 2% target for the rise in general price levels, the long-term inflation CPI inflation rate for the USA is 3.5%, above where we are today. The Fed may remain a problem, but only if they fail to recognize that inflation no longer is.
Have a great weekend!
David S. Waddell
CEO, Chief Investment Strategist
Sources: FRED, U.S. Bureau of Labor Statistics, Bloomberg L.P., Yardeni Research, BLS
Within the CPI report, housing-related inflation ticked slightly lower but remains 8% higher than year-ago levels. Given the outsized role of shelter within CPI, the vast majority of inflation within the report was housing related. In fact, if you strip out housing, headline inflation falls to 1.7%, and core inflation falls to 2.7%, well within the Fed’s target range. This chart depicts just how dramatically overall inflation has risen and fallen when excluding shelter inflation:
To further illustrate the rapid fall in price levels afoot, 45% of the items measured in June experienced outright deflation! With shelter sheltering inflation, when will these levels leg lower? Unfortunately, shelter inflation calculations in the CPI report arrive with considerable lags. Considering that the three-month rolling average shelter inflation rate is 6% and the June monthly rate annualizes at 4.4%, shelter inflation could fall more quickly than anticipated. Economists often reference more real-time gauges of shelter inflation like the Zillow Rent Index. Some have observed that the Zillow index tends to front-run the CPI shelter index by about one year. The Zillow index peaked early last year and recently reported rent inflation of 4% in June. The following chart harmonizes the two inflation indices and adjusts for the 12-month lag:
Well, isn’t that encouraging?!
If these proportions hold, shelter inflation within the Consumer Price Index could return to the Fed’s target levels within 12 months. With shelter’s outsized influence, shelter disinflation means deflating recession conviction at the Fed. Furthermore, stocks historically return three times more for investors when CPI falls than when it rises.
So, will this report keep the Fed at bay? Likely not. They have set expectations that they will raise rates another .25% on July 26th. Powell will undoubtedly site elevated wage inflation and “supercore” inflation that remains well above the 2% target. But even that fallback measure has lost momentum, as seen below:
In sum, we expect one more face-saving hike from the Fed with empty threats of doing more. Remember, while the Fed may have a 2% target for the rise in general price levels, the long-term inflation CPI inflation rate for the USA is 3.5%, above where we are today. The Fed may remain a problem, but only if they fail to recognize that inflation no longer is.
Have a great weekend!
David S. Waddell
CEO, Chief Investment Strategist
Sources: FRED, U.S. Bureau of Labor Statistics, Bloomberg L.P., Yardeni Research, BLS
This week the Federal Reserve paused its interest rate hiking campaign while tightening its rhetoric. The algorithms sold the bark aggressively, with immediacy, while the humans bought the lack of bite aggressively, with delay. By the end of the week, the S&P stood 3% above where it began. For investors clinging to their pessimism like rosary beads, this rally has become excruciating.
The second quarter ends in two weeks with the S&P now up 16% on the year. Clients will open statements expecting returns. Pressures will mount upon pessimistic professionals to either double down on their pessimistic forecasts or capitulate. Within the past two weeks, the economy has shown resilience, inflation has slowed substantially, the Fed has hit pause, and forward earnings estimates are rising. While this market has become highly technically overbought, pullbacks will provide cover for capitulators, likely limiting their severity. But where will the money go?
Beyond the Hype
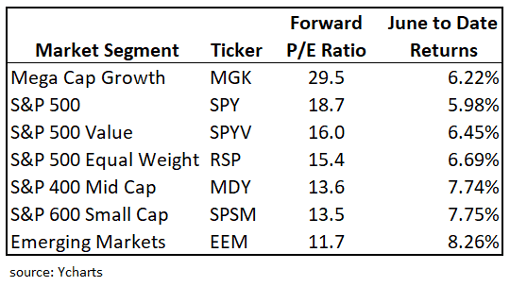
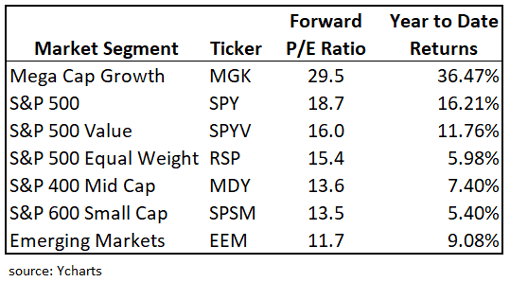
Despite the hype, those now entering the stock market supermarket will find some surprising bargains. They will not find them in the AI aisle, but they will find them nearly everywhere else. Consider the following valuations across investable market segments along with their year-to-date returns:
The valuation and performance differential between the mega cap driven S&P 500 and the non-S&P 500 segments provide ample mean reversion opportunities. For the mean to revert, either the megas need to catch down, or the rest of the market needs to catch up. Given the revival in economic and earnings confidence over the past couple of weeks, the catch-up trade has cause and traction. Note the June performance for the groups above:
For those who feel they may have “missed it”, the valuations and trailing returns for the non-S&P 500 segments appear anything but frothy. Should recession severity fears abate, the rise of the rest provides plenty of opportunity for capitulators to get involved.
The Dis-Inflation Motivation
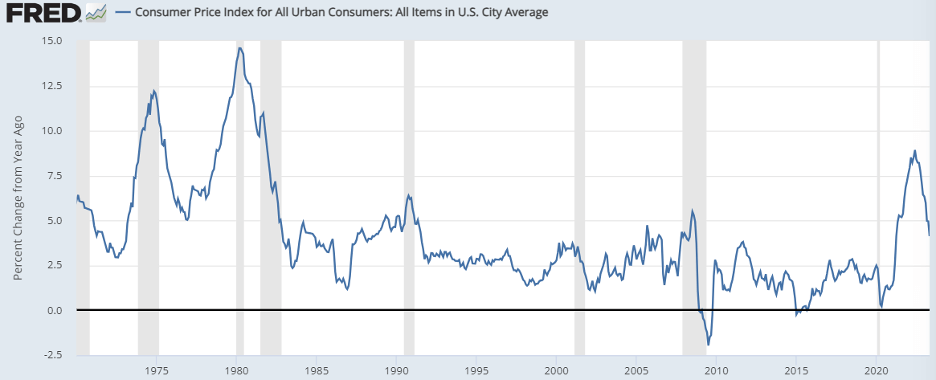
Tuesday’s Consumer Price Index release buoyed the market and cemented the Fed. As a huge fan of symmetry, I thought I would share this chart:
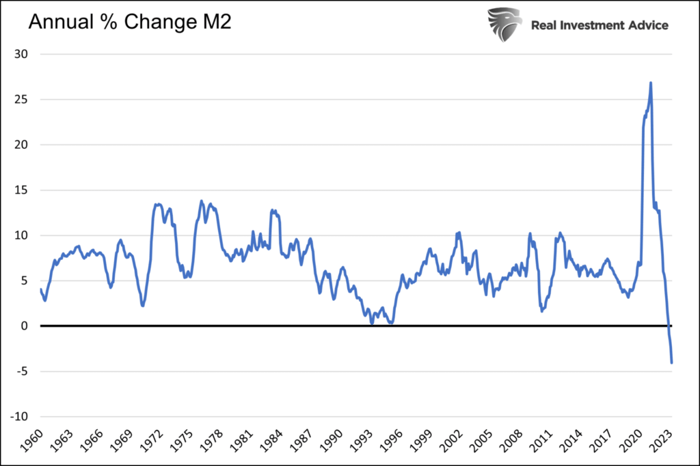
This chart chronicles the annual change for the Consumer Price Index over the last 50 years. Note that inflation never tends to hang around at highly elevated levels. On their own, higher prices crush demand which, in turn, leads to lower prices. Additionally, the Federal Reserve has a constitutional obligation to vigorously manage price levels. The combination of the two makes the persistently elevated inflation called for by the pessimists unlikely and historically unprecedented. Even in the 1970’s when the Fed had no experience managing money due to the recently terminated gold standard, peak inflation levels led to symmetrical troughs. The chart below chronicles the annual change in money supply (M2) going back to 1960:
Note the roughly 10% annual growth for US money supply in the 1970’s. This monetary mismanagement led to higher-than-average inflation rates for a decade. Even still, while average levels were higher, the inflationary spikes seen in 1975 and 1979 corrected symmetrically. Fast forward to today. COVID stimulus policies led to an astounding 30% growth rate for US money supply. But unlike in the 1970’s, this policy profligacy rapidly reversed.
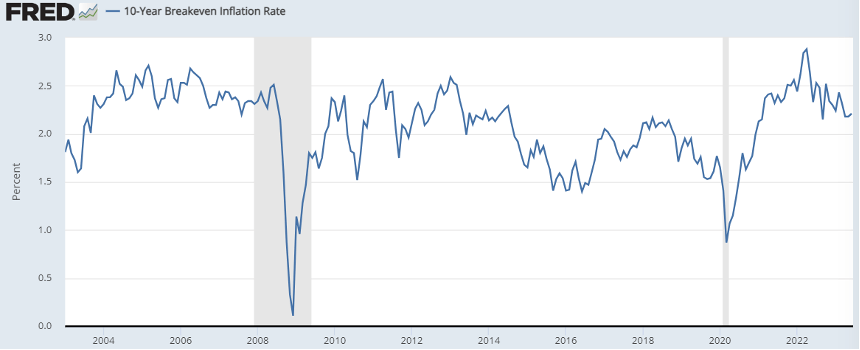
US money supply is now shrinking for the first time since the Great Depression. As a result, inflation has fallen even faster than it climbed. It took 14 months for this cycle’s inflation to climb from 4.1% to 9% and only 11 months for inflation to fall from 9% back to 4.1%. We will likely see 3% inflation in June, a level we haven’t seen since March of 2021. And just to further validate my simplistic “what goes up must come down” inflation hypothesis, markets agree, placing the 10 year forward inflation breakeven rate right at the Fed’s target of 2.2%:
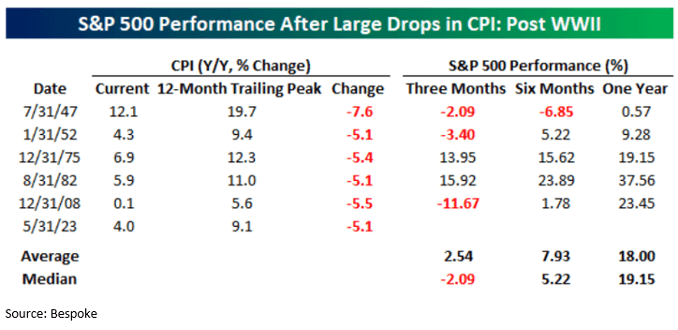
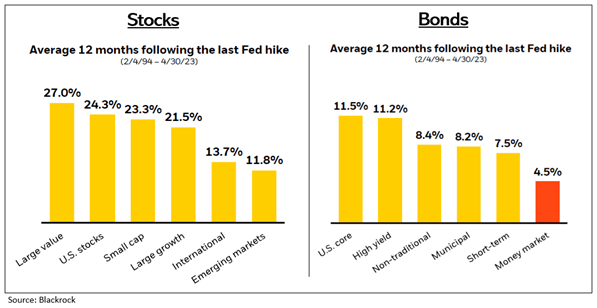
My point here is that inflation’s downward momentum has taken hold and inflation will continue to fall. It’s both science and policy at this point. And historically, periods of rapid disinflation have been followed by periods of robust investor returns:
This week the Federal Reserve paused its interest rate hiking campaign while tightening its rhetoric. The algorithms sold the bark aggressively, with immediacy, while the humans bought the lack of bite aggressively, with delay. By the end of the week, the S&P stood 3% above where it began. For investors clinging to their pessimism like rosary beads, this rally has become excruciating.
The second quarter ends in two weeks with the S&P now up 16% on the year. Clients will open statements expecting returns. Pressures will mount upon pessimistic professionals to either double down on their pessimistic forecasts or capitulate. Within the past two weeks, the economy has shown resilience, inflation has slowed substantially, the Fed has hit pause, and forward earnings estimates are rising. While this market has become highly technically overbought, pullbacks will provide cover for capitulators, likely limiting their severity. But where will the money go?
Beyond the Hype
Despite the hype, those now entering the stock market supermarket will find some surprising bargains. They will not find them in the AI aisle, but they will find them nearly everywhere else. Consider the following valuations across investable market segments along with their year-to-date returns:
The valuation and performance differential between the mega cap driven S&P 500 and the non-S&P 500 segments provide ample mean reversion opportunities. For the mean to revert, either the megas need to catch down, or the rest of the market needs to catch up. Given the revival in economic and earnings confidence over the past couple of weeks, the catch-up trade has cause and traction. Note the June performance for the groups above:
For those who feel they may have “missed it”, the valuations and trailing returns for the non-S&P 500 segments appear anything but frothy. Should recession severity fears abate, the rise of the rest provides plenty of opportunity for capitulators to get involved.
The Dis-Inflation Motivation
Tuesday’s Consumer Price Index release buoyed the market and cemented the Fed. As a huge fan of symmetry, I thought I would share this chart:
This chart chronicles the annual change for the Consumer Price Index over the last 50 years. Note that inflation never tends to hang around at highly elevated levels. On their own, higher prices crush demand which, in turn, leads to lower prices. Additionally, the Federal Reserve has a constitutional obligation to vigorously manage price levels. The combination of the two makes the persistently elevated inflation called for by the pessimists unlikely and historically unprecedented. Even in the 1970’s when the Fed had no experience managing money due to the recently terminated gold standard, peak inflation levels led to symmetrical troughs. The chart below chronicles the annual change in money supply (M2) going back to 1960:
Note the roughly 10% annual growth for US money supply in the 1970’s. This monetary mismanagement led to higher-than-average inflation rates for a decade. Even still, while average levels were higher, the inflationary spikes seen in 1975 and 1979 corrected symmetrically. Fast forward to today. COVID stimulus policies led to an astounding 30% growth rate for US money supply. But unlike in the 1970’s, this policy profligacy rapidly reversed.
US money supply is now shrinking for the first time since the Great Depression. As a result, inflation has fallen even faster than it climbed. It took 14 months for this cycle’s inflation to climb from 4.1% to 9% and only 11 months for inflation to fall from 9% back to 4.1%. We will likely see 3% inflation in June, a level we haven’t seen since March of 2021. And just to further validate my simplistic “what goes up must come down” inflation hypothesis, markets agree, placing the 10 year forward inflation breakeven rate right at the Fed’s target of 2.2%:
My point here is that inflation’s downward momentum has taken hold and inflation will continue to fall. It’s both science and policy at this point. And historically, periods of rapid disinflation have been followed by periods of robust investor returns:
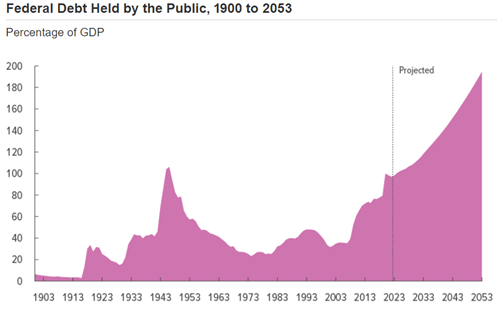
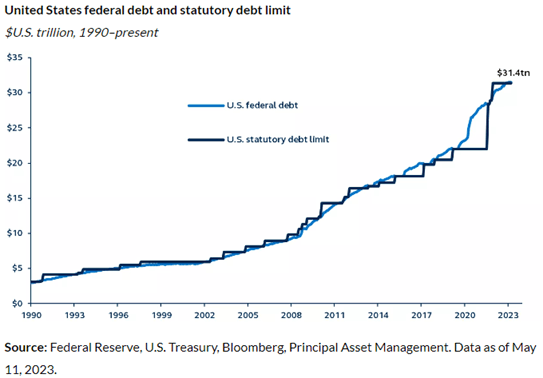
In 2008 and 2009, the Government took unprecedented actions to offset the Great Financial Crisis. Congress authorized the distribution of nearly $1 trillion in fiscal stimulus, while the Federal Reserve cut interest rates to zero and printed and injected $1 trillion+ in quantitative easing. This level of Government intervention in reaction to a “100-year economic event” shocked many market observers. Books filled shelves with writings about fiscal recklessness, financial profiteering, and Government overreach. Bailout Nation, Contagion, Endgame, The Big Short, The Sellout, and countless more sit on my shelves in a strong rebuke to what led to and what prevented the GFC. Occupy Wall Street Protests hit the streets, and the Tea Party hit the hill. Suddenly everyone became hyper-aware and hyper-sensitive to the Government deficits and accumulated debt. Warnings of hyperinflation, record interest rates, and collapsing dollars captivated audiences and nurtured the public animus that metastasized into the Obama vs. Tea Party debt limit stalemate in 2011. Ultimately, the parties found common ground, but not before Standard and Poor’s downgraded US Treasury debt, not upon fundamental merits, but in recognition of legislative dysfunction. Therein lies the crux. The chart below captures not only how much debt the US has accumulated since 1990 but also how many times legislators have fought and agreed to raise the limit.
Therefore, as the post-COVID debt ceiling crisis rages, the right question to ask is… does the US have a debt problem or a legislative problem?
The Fiat Effect
President Nixon closed the gold window in 1971, effectively ending the US Dollar’s convertibility into gold. This removed many legislative and monetary restraints and forced the Federal Reserve and Congress into the fiat backstop role gold had played to date. Unsurprisingly, the stock of accumulated debt rose significantly over the next 50 years. In fact, when Nixon closed the gold window, the US Treasury owed bondholders $400 million versus $31 trillion today. Over the same period, US GDP grew from $1 trillion to $25 trillion. Therefore, while the economy grew by 25x, US Treasury debt grew 82x. This should have profoundly impacted currency values, inflation rates, and interest rates, as widely espoused. But did it?
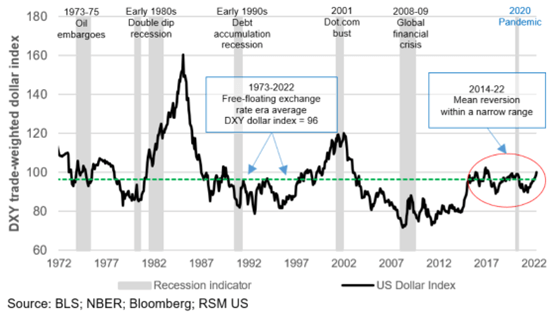
The US Dollar
While US debt climbed 82x over the period, the US Dollar vacillated within a range of 60% higher to 30% lower. Today, the dollar sits slightly below its 1971 divorce from gold level and right at its 50-year average.
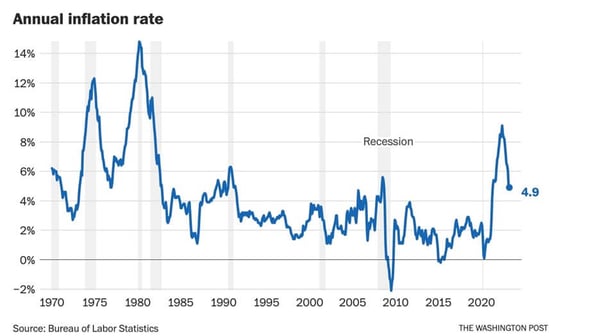
US Inflation Rates
While COVID profligacy led to a recent spike in inflation, the Consumer Price Index today sits well below its 1970 comparison. So, while US Treasury debt levels climbed 82x over the period, average US inflation rates have fallen significantly.
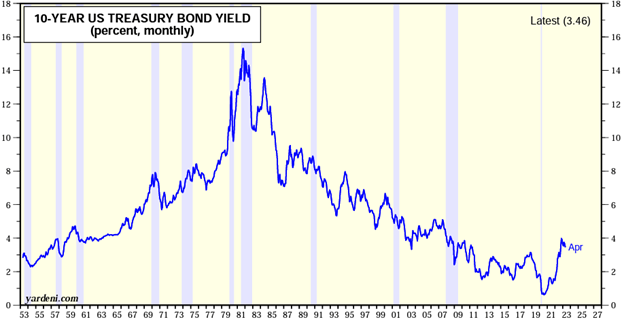
In alignment with the trajectory of US inflation rates, US interest rates have fallen since the 1970s, interrupted only by the COVID stimulus shock. So, while US Treasury debt levels climbed 82x over the period, US Treasury rates have fallen significantly.
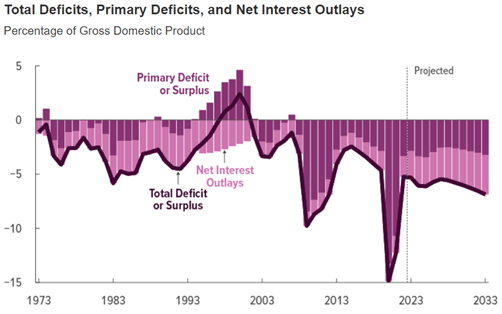
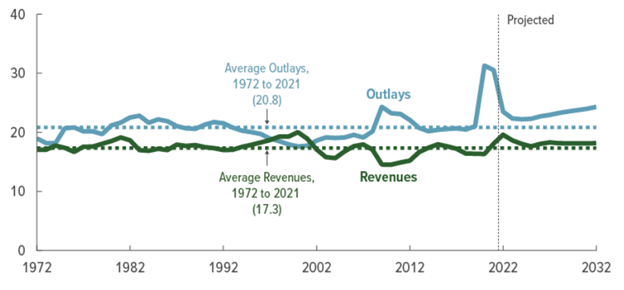
Remember, US Treasury debt grows only if the government spends more than it receives in tax revenues. Surprisingly, the percentage of each stream when compared with the size of the economy hasn’t changed that much since the 1970s:
As you can see, tax revenues have hugged their long-term average for the last 50 years. In fact, under Bill Clinton and Newt Gingrich (remember that shutdown?), the US ran a budget surplus into the year 2000. Since then, most of the debt accumulation has occurred in reaction to the GFC and COVID. Going forward, the CBO does project spending will rise more than revenues as Medicare, Medicaid, and Social Security consume more of Federal finances without scope for equivalent offsets in discretionary spending. These programs require reform to adhere to our fiscal norms of 3% average deficits, which get conveniently erased by 3% average inflation.
In summary, the 82x spike in US Treasury debt has negative cognitive consequences but few obvious economic ones. The US Dollar has vacillated higher and lower within a range but sits at its long-term, post-gold-standard average today. US inflation rates have fallen from 6% in 1970 to 4.9% today on their way back to their pre-COVID 2% levels. US interest rates have fallen from 7.5% in 1970 to 3.5% today on their way back to their pre-COVID 2.5-3% levels. Meanwhile, the US economy grew 25x. Arguments can certainly be made that more Government means less productivity and that crowding out the private sector has societal consequences, and I believe that narrative. Still, it’s virtually impossible in economics to prove “what would have been.” Will the US Government reach a point where the global financial markets capitulate, expel the US dollar from their reserves, drive inflation to Weimar levels, and drive interest rates stratospheric? Maybe. But consider that Japan has a debt-to-GDP ratio of 230% versus our 130%, and issues 10-year Government bonds with interest rates of .4%. US Government debt dynamics do not resemble household debt dynamics. Our Grecian moment may exist… but it’s a long way from here.
So, while economists largely agree that the long-term path for US debt accumulation is “unsustainable,” no one knows where the limit lies. Furthermore, while the debt limit fosters annual political conflicts over sustainability, the debt limit always rises and will continue without sweeping entitlement reform. In reaction to political pressures, President Obama tasked the Simpson-Bowles Commission with designing a fiscal path to stabilize the debt. They did just that. Unfortunately, the political will did not exist at the time to turn the recommendations into legislation. But someday, this may change either through courage or through crisis. But for now, the US debt load causes more political problems than economic ones.
In 2008 and 2009, the Government took unprecedented actions to offset the Great Financial Crisis. Congress authorized the distribution of nearly $1 trillion in fiscal stimulus, while the Federal Reserve cut interest rates to zero and printed and injected $1 trillion+ in quantitative easing. This level of Government intervention in reaction to a “100-year economic event” shocked many market observers. Books filled shelves with writings about fiscal recklessness, financial profiteering, and Government overreach. Bailout Nation, Contagion, Endgame, The Big Short, The Sellout, and countless more sit on my shelves in a strong rebuke to what led to and what prevented the GFC. Occupy Wall Street Protests hit the streets, and the Tea Party hit the hill. Suddenly everyone became hyper-aware and hyper-sensitive to the Government deficits and accumulated debt. Warnings of hyperinflation, record interest rates, and collapsing dollars captivated audiences and nurtured the public animus that metastasized into the Obama vs. Tea Party debt limit stalemate in 2011. Ultimately, the parties found common ground, but not before Standard and Poor’s downgraded US Treasury debt, not upon fundamental merits, but in recognition of legislative dysfunction. Therein lies the crux. The chart below captures not only how much debt the US has accumulated since 1990 but also how many times legislators have fought and agreed to raise the limit.
Therefore, as the post-COVID debt ceiling crisis rages, the right question to ask is… does the US have a debt problem or a legislative problem?
The Fiat Effect
President Nixon closed the gold window in 1971, effectively ending the US Dollar’s convertibility into gold. This removed many legislative and monetary restraints and forced the Federal Reserve and Congress into the fiat backstop role gold had played to date. Unsurprisingly, the stock of accumulated debt rose significantly over the next 50 years. In fact, when Nixon closed the gold window, the US Treasury owed bondholders $400 million versus $31 trillion today. Over the same period, US GDP grew from $1 trillion to $25 trillion. Therefore, while the economy grew by 25x, US Treasury debt grew 82x. This should have profoundly impacted currency values, inflation rates, and interest rates, as widely espoused. But did it?
The US Dollar
While US debt climbed 82x over the period, the US Dollar vacillated within a range of 60% higher to 30% lower. Today, the dollar sits slightly below its 1971 divorce from gold level and right at its 50-year average.
US Inflation Rates
While COVID profligacy led to a recent spike in inflation, the Consumer Price Index today sits well below its 1970 comparison. So, while US Treasury debt levels climbed 82x over the period, average US inflation rates have fallen significantly.
In alignment with the trajectory of US inflation rates, US interest rates have fallen since the 1970s, interrupted only by the COVID stimulus shock. So, while US Treasury debt levels climbed 82x over the period, US Treasury rates have fallen significantly.
Remember, US Treasury debt grows only if the government spends more than it receives in tax revenues. Surprisingly, the percentage of each stream when compared with the size of the economy hasn’t changed that much since the 1970s:
As you can see, tax revenues have hugged their long-term average for the last 50 years. In fact, under Bill Clinton and Newt Gingrich (remember that shutdown?), the US ran a budget surplus into the year 2000. Since then, most of the debt accumulation has occurred in reaction to the GFC and COVID. Going forward, the CBO does project spending will rise more than revenues as Medicare, Medicaid, and Social Security consume more of Federal finances without scope for equivalent offsets in discretionary spending. These programs require reform to adhere to our fiscal norms of 3% average deficits, which get conveniently erased by 3% average inflation.
In summary, the 82x spike in US Treasury debt has negative cognitive consequences but few obvious economic ones. The US Dollar has vacillated higher and lower within a range but sits at its long-term, post-gold-standard average today. US inflation rates have fallen from 6% in 1970 to 4.9% today on their way back to their pre-COVID 2% levels. US interest rates have fallen from 7.5% in 1970 to 3.5% today on their way back to their pre-COVID 2.5-3% levels. Meanwhile, the US economy grew 25x. Arguments can certainly be made that more Government means less productivity and that crowding out the private sector has societal consequences, and I believe that narrative. Still, it’s virtually impossible in economics to prove “what would have been.” Will the US Government reach a point where the global financial markets capitulate, expel the US dollar from their reserves, drive inflation to Weimar levels, and drive interest rates stratospheric? Maybe. But consider that Japan has a debt-to-GDP ratio of 230% versus our 130%, and issues 10-year Government bonds with interest rates of .4%. US Government debt dynamics do not resemble household debt dynamics. Our Grecian moment may exist… but it’s a long way from here.
So, while economists largely agree that the long-term path for US debt accumulation is “unsustainable,” no one knows where the limit lies. Furthermore, while the debt limit fosters annual political conflicts over sustainability, the debt limit always rises and will continue without sweeping entitlement reform. In reaction to political pressures, President Obama tasked the Simpson-Bowles Commission with designing a fiscal path to stabilize the debt. They did just that. Unfortunately, the political will did not exist at the time to turn the recommendations into legislation. But someday, this may change either through courage or through crisis. But for now, the US debt load causes more political problems than economic ones.
Before every media appearance, I take time to distill my thoughts down into digestible soundbites. On Friday, I appeared on Yahoo! Finance Live with Rachelle Akuffo. To mix things up in this week’s Strategic Insight, I thought I would invite you into the green room and simply share the notes I created to prepare for that segment. Ready… Action!
Talking Points for 5/12/23 Yahoo! Finance Appearance
Markets have gone nowhere over the past year. S&P 500 closed at 3930 on May 12th of 2022 and trades at 4105 today. Entering seasonally weak period (May – October) with the Fed tight, recession on delivery, and politics disorderly. Using a stoplight analogy, the government is flashing red, the economy is flashing yellow, while corporate earnings are flashing green, thanks to executive acumen. It’s a good thing we invest in companies and not governments!
The Fed:
Interest rate hikes now on pause – without conviction
Quantitative tightening now on pause – without conviction
($400B in QE after SVB programs announced, $200B QT since)
Debt Limit:
Biden and friends will need to deal with the debt ceiling within the next 5 days while everyone is in DC. Using the 14th Amendment to claim the debt ceiling is unconstitutional would create a constitutional crisis. Not happening. Deal or delay to the fall for budget season are the only options.
The deficit ran $1.9 trillion over the past 12 months. After June 1(?) spending will be restricted to tax receipts which are plenty to cover interest payments… therefore no default on tap, just rationing elsewhere.
2011 Analog: Tea Party ran over Obama with the Budget Control Act which cut spending by $100 billion over the following few quarters. Spending didn’t rise above the pre-Act level until 2014. S&P 500 fell 15% in Q3, erasing the gains for the year, and finished the year flat—not because of the credit downgrade everyone remembers, but because of the tight fiscal conditions triggered by the austerity Act.
Inflation:
Now surprising to the downside
CPI:
April .4% monthly number weaker than whispered, 4.9% annual less than 5%.
Shelter, Used Cars & Vehicle Insurance drove the advance, otherwise the number would have been close to 0% month over month. Vehicle inflation a bit of a head-scratcher with all of the incentives on offer and price downticks at major auctions. Housing really drove the number… but it lags badly.
Supercore:
Fed favorite core services ex-housing measure has decelerated by half since
January, now running about 2.8% annualized… pretty close to target.
PPI:
Running 2.3% annualized, lowest level since January 2021.
No June Hike!
2-year yield peaked at 5.05% on March 8th, sits at 3.9% today.
Futures pricing in less than 10% chance of a hike in June.
Economy:
Clearly decelerating, with the bank credit crunch draining the micro economy… year-to-date bankruptcies are now the highest they have been since 2010. The macro economy dealing with wall street financing faring better… but credit tightening will bite there too. This is what the Fed wants. The US money supply is down 5% over the past year, that’s the opposite of money creation. Initial Jobless claims surprising higher. The labor market is clearly softening.
Earnings:
According to the analysts, this quarter represents the trough for absolute earnings after peaking in Q2 of 2022. The drawdown estimated to be 11% from the top has proven to be only 7% at this point. Companies have done a MUCH BETTER job managing profit margins through this period than analysts expected!
If that continues and the economy rebounds after a shallow recession, S&P 500 earnings could hit $250 in 2024. Additionally, falling inflation and interest rates would support a higher P/E multiple (19x up from 18x). The two combined get us to 4750. We are at 4100 today.
Then consider what’s possible further out as corporate reorganizations, labor rationalizations and AI installations contribute to big operating leverage. Analysts predict $275 for 2025…multiply that by 19 and you get to 5225, or 27% higher than today. Which is well within the range of average post-recession returns.
S&P 500 Earnings Results/Estimates:
Q1: -2% actual earnings growth vs. -7% estimates. 80% of reporting companies beat estimates. Those that beat had upside surprise of 7% Even with only 3.9% Revenue growth – weakest since Q4 2020
Q2e: -5.7%
Q3e: 1.2%
Q4e: 8.5%
2023e: 2.3%, Estimates have RISEN lately.
2024e: 10.3%, Estimates have RISEN lately.
Technicals:
Just entered the historically weakest 6 months period of May through October.
Outside of Big Cap, tech-boosting headline indices, 2023 returns are essentially zero.
Likely due to a 5-10% pullback for the S&P somewhere over the next few months as tech tires out and recession arrives. Once we get a rise in the unemployment rate or a cut in interest rates, the recovery rally should begin in earnest.
Valuations:
S&P 500: 18.0x
S&P 400: 13.2x
S&P 600: 12.5x
World Ex-USA: 12.8x
Sentiment:
30% of retail investors bullish, neutral territory and above my “get excited” level of 20%.