Early this week, the FDIC seized the feeble First Republic Bank and arranged its matrimony to the stalwart JP Morgan. With regulatory assistance and assurances, JP Morgan paid roughly 10 billion dollars to acquire $100 billion in customer deposits, $200 billion in loans and securities, and $300 billion in wealth management assets under management. While that amounts to a sweetheart deal for Jamie Dimon and JP Morgan, it also established a not-so-sweet valuation mark for embattled regional banks.
On Wednesday, Chairman Powell focused his testimony and remarks on hiking rates and pausing guidance, apparently unconcerned about shotgun weddings and cascading bank failures. JPMs vulture valuation signal, combined with Powell’s systematic inattentiveness and PacWest’s pursuit of “strategic options,” throttled regional bank stocks Thursday with several declining 20% or more. Whether or not these banks deserved their beating isn’t relevant. Banks cannot exist without confidence in them, no matter how robust the fundamentals are. This makes them particularly vulnerable to Twitter tornadoes and short-seller raids.
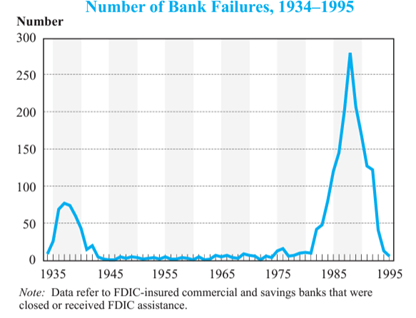
I listened to several self-serving prognosticators piling on at the Milken conference, calling for the elimination of hundreds of banks. Unfortunately, historical analogs do offer precedent, as significant US bank casualties followed Volker’s inflation-fighting campaign in the early 1980s.
In fact, between 1980 and 1995, 1600 US banks failed. Regulatory rollbacks, financial innovations, and increased competition contributed more to the failure volumes than inflation-fighting rate hikes. Still, the mere suggestion of reprisal supports selling the regionals today “for safety.” Taken together, regional banks plagued by deposit flight, known losses on securities portfolios, unknown losses on loan portfolios, rising FDIC insurance premiums, reactive regulatory overreach, JPM+FRB’s shotgun wedding valuations, heightened recession risks and post-Volker bank terminations history leave little for bank investors to love.
The 144 banks within the S&P Regional Bank index (ticker: KRE) have collectively lost investors nearly 40% in 2023. For those considering bargain shopping, be warned, these names have become trading vehicles with indeterminate value, and the short sellers hold the megaphones. While placing short-term wagers may seem seductive, it has not proven profitable for many in 2023.
Keep your Hands and Feet “Inside” the Vehicle
Sideways markets often tempt longer-term investors to become shorter-term traders. For instance, the dramatic downside volatility in regional bank stocks will undoubtedly produce dramatic upside volatility as well.
Get rich quick!
Similarly, AI-themed stocks ran up dramatically to begin the year, only to sell off sharply over the past month.
Get poor quick!
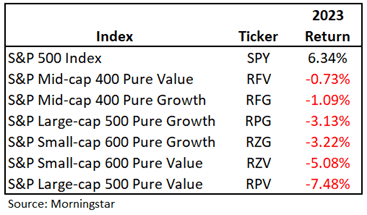
Timing mistakes trying to catch these booms and busts can dramatically undermine longer-term performance. To judge the environment for better outperformance odds, we often examine the relative performance of the pure style indices vs. the core indices like the S&P 500 index. The pure style indices contain the growth-iest of the growth names and the value-iest of the value names. We call environments when the S&P 500 index outperforms the pure style indices “inside” markets. Conversely, we call environments when the S&P 500 underperforms the pure style indices “outside” markets. “Inside” markets make the S&P tough to beat, and “outside” markets offer multiple ways to win. Here is an account of the S&P 500 and pure style indices performance so far in 2023:
Clearly, per our criteria, this is an “inside” market. Rarely do we see the S&P 500 outperform the pure style indices to this degree. For investors who have ventured “outside,” it’s been an exceedingly difficult year. For W&A, this has led our investment committee to resist chasing immature trends. Until the dynamics of the table above invert, this market remains an “inside” market, full of many ways to lose and few ways to win. The time to chase volatility and trends will come, but it’s not now. Keep your portfolios unimaginative for now. Often in investing, boring is better.
Caveat: This analysis was domestic. Internationally, the trends have proven much more reliable. The EAFE index (largely Europe) has appreciated 11% year to date and has outperformed the S&P 500 over the one-month, three-month, year-to-date, and one-year timeframes. In fact, while the S&P 500 has fallen 4% over the past year, the EAFE has appreciated 6.5%. Even if we incorporate every single international stock, including the challenged Chinese names, the outperformance remains with the MSCI Total International Stock Index (Ticker: IXUS) up 8% against 6% for the S&P 500. Given our global approach, our offshore investments have provided a welcome ballast for our onshore investors.
Early this week, the FDIC seized the feeble First Republic Bank and arranged its matrimony to the stalwart JP Morgan. With regulatory assistance and assurances, JP Morgan paid roughly 10 billion dollars to acquire $100 billion in customer deposits, $200 billion in loans and securities, and $300 billion in wealth management assets under management. While that amounts to a sweetheart deal for Jamie Dimon and JP Morgan, it also established a not-so-sweet valuation mark for embattled regional banks.
On Wednesday, Chairman Powell focused his testimony and remarks on hiking rates and pausing guidance, apparently unconcerned about shotgun weddings and cascading bank failures. JPMs vulture valuation signal, combined with Powell’s systematic inattentiveness and PacWest’s pursuit of “strategic options,” throttled regional bank stocks Thursday with several declining 20% or more. Whether or not these banks deserved their beating isn’t relevant. Banks cannot exist without confidence in them, no matter how robust the fundamentals are. This makes them particularly vulnerable to Twitter tornadoes and short-seller raids.
I listened to several self-serving prognosticators piling on at the Milken conference, calling for the elimination of hundreds of banks. Unfortunately, historical analogs do offer precedent, as significant US bank casualties followed Volker’s inflation-fighting campaign in the early 1980s.
In fact, between 1980 and 1995, 1600 US banks failed. Regulatory rollbacks, financial innovations, and increased competition contributed more to the failure volumes than inflation-fighting rate hikes. Still, the mere suggestion of reprisal supports selling the regionals today “for safety.” Taken together, regional banks plagued by deposit flight, known losses on securities portfolios, unknown losses on loan portfolios, rising FDIC insurance premiums, reactive regulatory overreach, JPM+FRB’s shotgun wedding valuations, heightened recession risks and post-Volker bank terminations history leave little for bank investors to love.
The 144 banks within the S&P Regional Bank index (ticker: KRE) have collectively lost investors nearly 40% in 2023. For those considering bargain shopping, be warned, these names have become trading vehicles with indeterminate value, and the short sellers hold the megaphones. While placing short-term wagers may seem seductive, it has not proven profitable for many in 2023.
Keep your Hands and Feet “Inside” the Vehicle
Sideways markets often tempt longer-term investors to become shorter-term traders. For instance, the dramatic downside volatility in regional bank stocks will undoubtedly produce dramatic upside volatility as well.
Get rich quick!
Similarly, AI-themed stocks ran up dramatically to begin the year, only to sell off sharply over the past month.
Get poor quick!
Timing mistakes trying to catch these booms and busts can dramatically undermine longer-term performance. To judge the environment for better outperformance odds, we often examine the relative performance of the pure style indices vs. the core indices like the S&P 500 index. The pure style indices contain the growth-iest of the growth names and the value-iest of the value names. We call environments when the S&P 500 index outperforms the pure style indices “inside” markets. Conversely, we call environments when the S&P 500 underperforms the pure style indices “outside” markets. “Inside” markets make the S&P tough to beat, and “outside” markets offer multiple ways to win. Here is an account of the S&P 500 and pure style indices performance so far in 2023:
Clearly, per our criteria, this is an “inside” market. Rarely do we see the S&P 500 outperform the pure style indices to this degree. For investors who have ventured “outside,” it’s been an exceedingly difficult year. For W&A, this has led our investment committee to resist chasing immature trends. Until the dynamics of the table above invert, this market remains an “inside” market, full of many ways to lose and few ways to win. The time to chase volatility and trends will come, but it’s not now. Keep your portfolios unimaginative for now. Often in investing, boring is better.
Caveat: This analysis was domestic. Internationally, the trends have proven much more reliable. The EAFE index (largely Europe) has appreciated 11% year to date and has outperformed the S&P 500 over the one-month, three-month, year-to-date, and one-year timeframes. In fact, while the S&P 500 has fallen 4% over the past year, the EAFE has appreciated 6.5%. Even if we incorporate every single international stock, including the challenged Chinese names, the outperformance remains with the MSCI Total International Stock Index (Ticker: IXUS) up 8% against 6% for the S&P 500. Given our global approach, our offshore investments have provided a welcome ballast for our onshore investors.
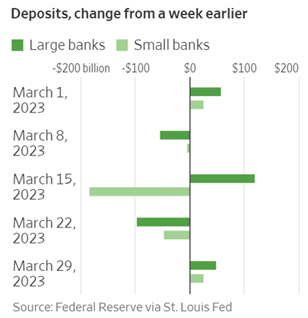
The Federal Reserve acted quickly and decisively to limit contagion after depositors fled Silicon Valley Bank and Signature Bank. While First Republic Bank and a few other lenders teetered on edge, the Fed’s liquidity programs provided enough stability to stop the panic. In fact, deposit trends have improved for small banks, as seen below:
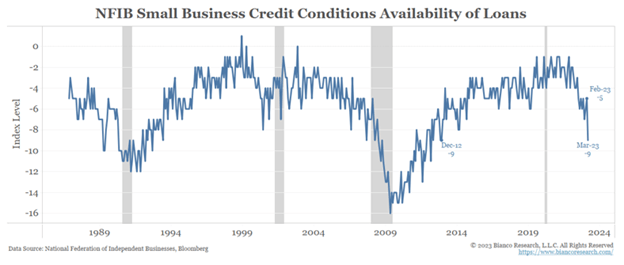
While the acute liquidity crisis may have passed, rattled bank boardrooms have become far more cautious. Credit conditions have tightened dramatically to levels only seen during prior recessions. Small businesses have reported the least access to credit dating back to the Great Financial Crisis per the most recent survey from the National Federation of Independent Businesses:
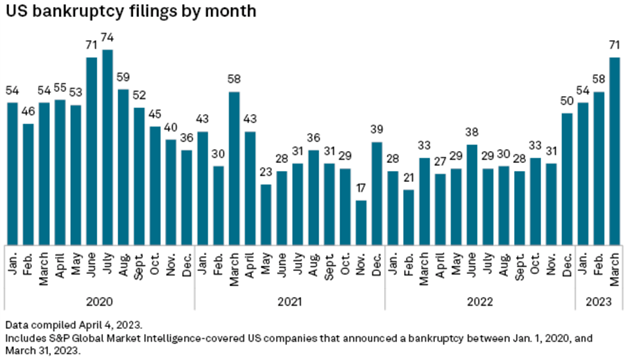
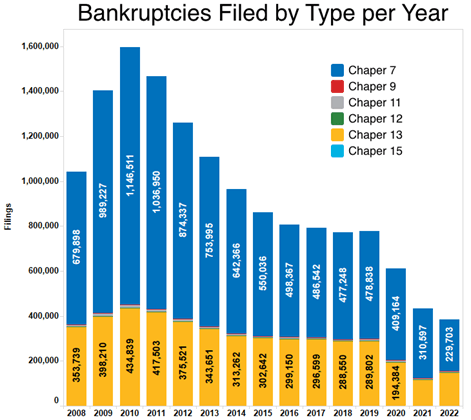
And as credit conditions tighten, economic conditions deteriorate like the withering of a fern without water. In fact, corporate bankruptcy filings for March in the United States have now reached levels last seen during the COVID quarantines:
In our credit-fueled economic system, reductions in credit extensions have consequences. But before you get too pessimistic, remember that this is precisely what the Fed wants! Jerome Powell first used the phrase “pain” to describe the Fed’s policy objective at his Jackson Hole speech six months ago. Since then, the Fed has increased overnight interest rates at a breakneck pace. The purpose of increasing interest rates swiftly was to force banks to limit lending swiftly.
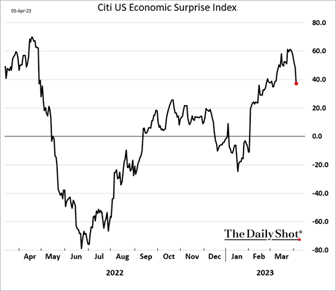
Simply put, banks pay depositors for money they then loan out at higher rates. Before rates increased, banks paid depositors 0% and loaned money to borrowers at 3-5%. Now banks have to pay depositors 5%, forcing them to lend money to borrowers at 8-10%. Borrowers might be willing and able to borrow lots of money at 3-4% in a booming economy, but they are far less willing and able to borrow lots of money at 8-10% in a soft economy. While Powell may have called for these conditions in August, banks received a 0% grace period from depositors now demanding much higher rates after the SVB revelation. In other words, what Powell called for in August of 2022, has now hit in March of 2023. For further evidence of the economic downshift, consider the rapid decline in the Citigroup Economic Surprise index. We have received a string of economic releases post-SVB, surprising to the downside. This includes the most recent consumer and producer price inflation releases as well:
This chain of events and data confirmation led Fed staffers to concede (more likely celebrate) that the US economy will enter recession this year. The severity and duration of which will now consume the debate.
Welcome to the Recession
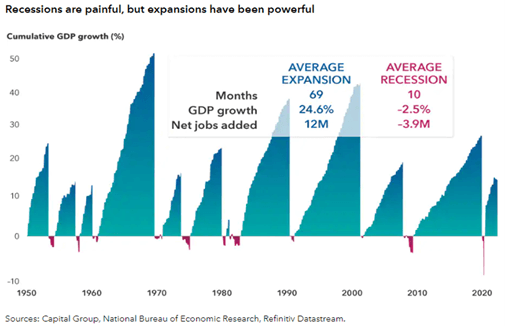
With the Fed determined to trigger an economic recession, its initiation provides perverse relief. Given that Powell has been browbeating us with mean-spirited forward guidance for over a year, investors and corporate executives have already been in a psychological recession. Investors sold stock markets down to their median 25% recessionary decline in 2022, and corporations have announced large-scale restructurings and layoffs in 2023. These events typically occur during recessions, not before! So, while GDP reports may not depict recession, marketplace activity reports do, as players prepare for the “pain” game. How much pain should we expect?
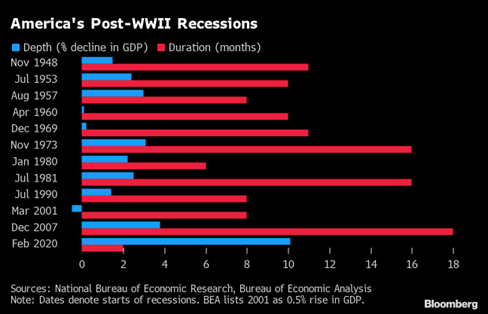
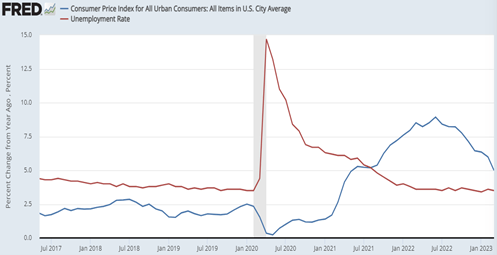
On average, in the post-war period, recessions last about three quarters, and GDP falls about 2.5%. Unemployment levels shoot higher as businesses reactively and rapidly shed costs. History doesn’t repeat, but it rhymes. Therefore, we should expect a 1-2ish percent GDP decline over a three-quarter period. However, given that businesses entered their psychological recession months ago at the Fed’s urging, they have had the ability to cut costs more methodically and strategically by firing excess real estate and administrative complexities in advance rather than firing staff in reaction. This should add ballast beneath the oncoming recession, leading to a disproportionate drop in inflation versus the rise in unemployment, as already seen in my favorite fog-cutting chart of the year:
Consumer Price Inflation fell from 9% in June 2022 to 5% in March 2023. Meanwhile, the unemployment rate fell from 3.6% in June 2022 to 3.5% in March 2023. For those Phillips Curve disciples who assert that inflation cannot reach the Fed’s 2% target level without a substantial rise in unemployment, the data and I doth protest. Inflation vacillated between 2% and 2.5% before the pandemic, while the unemployment rate fluctuated between 3.5% and 4% for years.
So, bring on the recession, Mr. Powell. Get it over with. We are prepared, we have been awaiting it, and we can endure it without mass layoffs and earnings collapses. In fact, markets are nearly a year ahead of you and already in recovery. Tighten again, if you like, for assurances, but you will be cutting before year-end. By that time, sentiment will have migrated from denial, anger, and acceptance toward confidence and optimism because what we know as investors and corporate leaders is that recessions are exceptions. Expansions are the rule.
Enjoy your Sunday!
Sources: Capital Group, FRED, Bloomberg, Federal Reserve of St. Louis
The Federal Reserve acted quickly and decisively to limit contagion after depositors fled Silicon Valley Bank and Signature Bank. While First Republic Bank and a few other lenders teetered on edge, the Fed’s liquidity programs provided enough stability to stop the panic. In fact, deposit trends have improved for small banks, as seen below:
While the acute liquidity crisis may have passed, rattled bank boardrooms have become far more cautious. Credit conditions have tightened dramatically to levels only seen during prior recessions. Small businesses have reported the least access to credit dating back to the Great Financial Crisis per the most recent survey from the National Federation of Independent Businesses:
And as credit conditions tighten, economic conditions deteriorate like the withering of a fern without water. In fact, corporate bankruptcy filings for March in the United States have now reached levels last seen during the COVID quarantines:
In our credit-fueled economic system, reductions in credit extensions have consequences. But before you get too pessimistic, remember that this is precisely what the Fed wants! Jerome Powell first used the phrase “pain” to describe the Fed’s policy objective at his Jackson Hole speech six months ago. Since then, the Fed has increased overnight interest rates at a breakneck pace. The purpose of increasing interest rates swiftly was to force banks to limit lending swiftly.
Simply put, banks pay depositors for money they then loan out at higher rates. Before rates increased, banks paid depositors 0% and loaned money to borrowers at 3-5%. Now banks have to pay depositors 5%, forcing them to lend money to borrowers at 8-10%. Borrowers might be willing and able to borrow lots of money at 3-4% in a booming economy, but they are far less willing and able to borrow lots of money at 8-10% in a soft economy. While Powell may have called for these conditions in August, banks received a 0% grace period from depositors now demanding much higher rates after the SVB revelation. In other words, what Powell called for in August of 2022, has now hit in March of 2023. For further evidence of the economic downshift, consider the rapid decline in the Citigroup Economic Surprise index. We have received a string of economic releases post-SVB, surprising to the downside. This includes the most recent consumer and producer price inflation releases as well:
This chain of events and data confirmation led Fed staffers to concede (more likely celebrate) that the US economy will enter recession this year. The severity and duration of which will now consume the debate.
Welcome to the Recession
With the Fed determined to trigger an economic recession, its initiation provides perverse relief. Given that Powell has been browbeating us with mean-spirited forward guidance for over a year, investors and corporate executives have already been in a psychological recession. Investors sold stock markets down to their median 25% recessionary decline in 2022, and corporations have announced large-scale restructurings and layoffs in 2023. These events typically occur during recessions, not before! So, while GDP reports may not depict recession, marketplace activity reports do, as players prepare for the “pain” game. How much pain should we expect?
On average, in the post-war period, recessions last about three quarters, and GDP falls about 2.5%. Unemployment levels shoot higher as businesses reactively and rapidly shed costs. History doesn’t repeat, but it rhymes. Therefore, we should expect a 1-2ish percent GDP decline over a three-quarter period. However, given that businesses entered their psychological recession months ago at the Fed’s urging, they have had the ability to cut costs more methodically and strategically by firing excess real estate and administrative complexities in advance rather than firing staff in reaction. This should add ballast beneath the oncoming recession, leading to a disproportionate drop in inflation versus the rise in unemployment, as already seen in my favorite fog-cutting chart of the year:
Consumer Price Inflation fell from 9% in June 2022 to 5% in March 2023. Meanwhile, the unemployment rate fell from 3.6% in June 2022 to 3.5% in March 2023. For those Phillips Curve disciples who assert that inflation cannot reach the Fed’s 2% target level without a substantial rise in unemployment, the data and I doth protest. Inflation vacillated between 2% and 2.5% before the pandemic, while the unemployment rate fluctuated between 3.5% and 4% for years.
So, bring on the recession, Mr. Powell. Get it over with. We are prepared, we have been awaiting it, and we can endure it without mass layoffs and earnings collapses. In fact, markets are nearly a year ahead of you and already in recovery. Tighten again, if you like, for assurances, but you will be cutting before year-end. By that time, sentiment will have migrated from denial, anger, and acceptance toward confidence and optimism because what we know as investors and corporate leaders is that recessions are exceptions. Expansions are the rule.
Enjoy your Sunday!
Sources: Capital Group, FRED, Bloomberg, Federal Reserve of St. Louis
I spoke with two reporters to close out last week who seemed baffled by the market’s strength amidst the recent tumult. Highly understandable. With deposits spilling out of small and regional banks choking off consumer, business, and real estate credit, with the Fed raising rates to use recession to fight inflation, with war ever escalating in Ukraine, with the US declaring a commercial cold war on China, with debt ceiling brinkmanship brewing in DC and Trump indicted in Manhattan… shouldn’t this market be falling? One would think, and yet the first quarter ended with the Dow flat, the S&P 500 up 6%, and the NASDAQ up 15%. Bulls, explain thyselves!
What Fuels Rallies?
You may have heard that bull markets always climb the wall of worry. Investors are natural skeptics. Psychologically, pessimism feels much safer and justifiable than optimism. Cash buys certainty; investment, uncertainty. Therefore, bull markets require the constant conversion of the skeptical and their cash. Remember, at the root of it all, cashflows determine market performance. When cash flows in, markets rise; when cash flows out, markets fall. High cash reservoir levels imply high rally potential. Low cash reservoirs imply rally exhaustion. Tell me what’s in the reservoirs and the mood of investors, and I can quickly calculate rally potential.
Each quarter the Federal Reserve releases its Flow of Funds reports providing insight into US financial conditions. The above chart accounts for household currency, checking accounts, savings accounts, and money market fund levels. At the end of 2022, US Households held $18 trillion in cash equivalents versus $13.3 trillion at the end of 2019. We saw a slight drawdown in cash levels toward the end of 2022. Where do you guess that went?
While checking and savings balances have migrated into money market funds, they have also migrated into bonds and bond funds, given the robust yields on offer. Conversely, negative US equity outflows offset foreign equity inflows leading to net negative flows for stock market mutual funds and ETFs. So, any depletion in cash has only increased bond holdings, not stock holdings. For one last reservoir look, Money Market Fund holdings overall have now reached record levels:
Clearly, the cash reservoirs overfloweth! Now, let’s check in on mood. As referenced a couple of weeks ago, investors have rarely been less optimistic, with only 19% of those surveyed by the AAII (American Association of Individual Investors) on March 15th anticipating gains ahead:
On average, since 1986, 37.5% of respondents typically see gains ahead, making the 19% level reached on March 15th roughly half of historical norms. In my anecdotal experience, Bullish sentiment below 20% signals rallies ahead. Since March 15th, bullish sentiment has increased nearly three percentage points to 22.5%. Over the same period, the S&P 500 rose 7%. Yet, at 22%, optimism remains far below normal leaving plenty of worry wall to scale.
So how can markets rally with deposits spilling out of small and regional banks choking off consumer, business, and real estate credit; with the Fed raising rates to use recession to fight inflation; with war ever escalating in Ukraine; with the US declaring a commercial cold war on China; with debt ceiling brinkmanship brewing in DC, and Trump indicted in Manhattan? Because based upon historic cash levels and despondent sentiment levels, these horribles have already been accounted for! It DOES NOT MATTER whether reality is good or bad for stocks to advance, only that reality arrives better than expectations. And while the bank panic over the last few weeks signaled crisis, the Fed’s response signaled a bailout. With the crisis threat neutralized by the bailout promise, markets recalibrated to the base case for 2023 of a mild recession, a 10% earnings drawdown, and perhaps one more hike from the Fed as inflation slowly deflated into year-end. Remember, we accounted for these variables last year. In 2023, no crisis means no reason to decline further. With cash reservoirs full and optimism scarce… it doesn’t take much!
Enjoy your Sunday!
Sources: FRED, BofA Global Research, EPFR Goldman Sachs Global Investment Research
A year ago, I sat on a panel with lawyers and investment bankers in the turnaround industry. These specialists serve companies in distress at or near the point of bankruptcy. Sadly for them, they had no work at the time as the Government guaranteed all debt during the pandemic while shoveling money into the pockets of poor performers. Many of these providers had to close up shop or pivot into other vocations amidst the shrinking supply of distress:
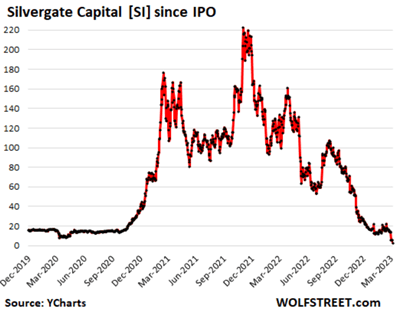
By suppressing business distress, policymakers created a “moral hazard” of inflated business confidence leading to less scrutinous deal diligence and investor overconfidence. At the event, someone asked me if this largesse would cause another Great Financial Crisis. Not likely, I responded. The largest banks before the GFC figured out how to operate beyond the regulators’ reach by setting up an entire “shadow banking system” through derivatives. In response to the GFC, regulators tightened controls, significantly increased capital requirements, and frequently subjected the systematically important banks to stress tests. When cycles turn, it’s the unregulated areas of the marketplace that inflate and pop, with regulation close behind. So, while I didn’t expect another systematic financial inferno this go-round, I did expect brush fires amidst the “moral hazard” overgrowth. The largest unregulated bubbles blown since the GFC exist in cryptocurrency and venture capital. Over the past few weeks, two banks dedicated to these industries immolated. Silvergate Bank lent money to Crypto firms:
With the market cap of crypto down 75%, massive fraud and abuse scams unmasked, and support capital scarce, it’s a wonder Silvergate lasted this long!
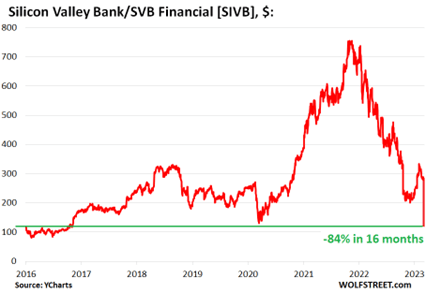
On a larger scale, Silicon Valley Bank took in deposits from venture capital-backed technology startups and then lent money out to venture capital-backed technology startups. Since venture capital-backed technology start-ups rarely make money, they require a continuous flow of credit or equity to fuel operations. When the money stops flowing (no other lenders, venture capital frozen, IPO window closed), deposits evaporate. As companies run out of capital, valuations evaporate. The combination of a collapse in deposit levels and a collapse in collateral values forced Silicon Valley Bank to try and raise more capital, a white-hot distress flare for investors:
Unable to raise capital or forestall deposit runs, the FDIC was forced to step in and padlock the doors.
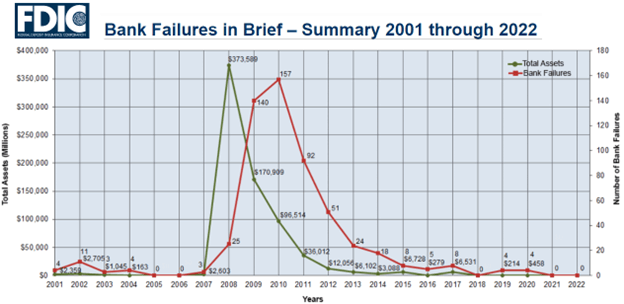
In short, overabundant capital, plus overconfidence in unregulated cryptocurrency and venture capital markets, led to misguided banking concentrations at Silvergate and Silicon Valley Bank, cueing the first bank failures since the COVID lockdowns in 2020:
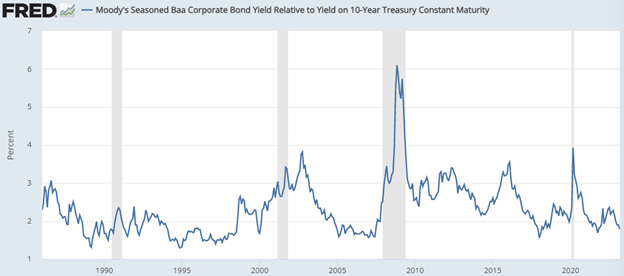
The right question to ask now is, do these two rouge lenders signal a systematic crisis on approach, as the failure of Washington Mutual signaled in 2008? I don’t think so. Distress in crypto and venture doesn’t seem to have tripped distress warnings elsewhere. To assess systematic stress levels quickly, let’s look closely at credit spreads (the difference in yields between bond categories and risk-free treasuries). First, let’s look at moderate-risk corporate bond spreads:
In 2007, this spread shot higher from 1.5% to over 6% in short order. In 2020, this spread shot higher from 2% to 4% in short order. Today this spread sits at 1.79%, down from the 2.4% reached last summer. No signs of distress here.
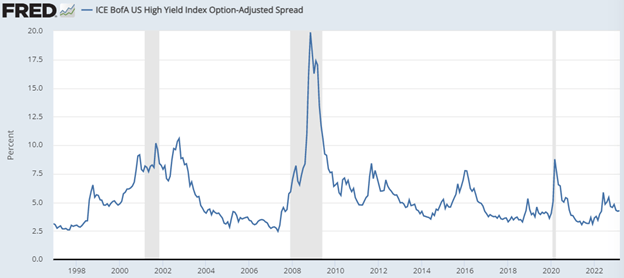
Next, let’s look at high-yield/higher-risk corporate bond spreads:
In 2007, this spread shot higher from 2.5% to over 20% in short order. In 2020, this spread shot higher from 3% to 10% in short order. Today this spread sits at 4.3%, down from nearly 6% reached last summer. No signs of distress here.
Overall, corporate America shows no imminent signs of default.
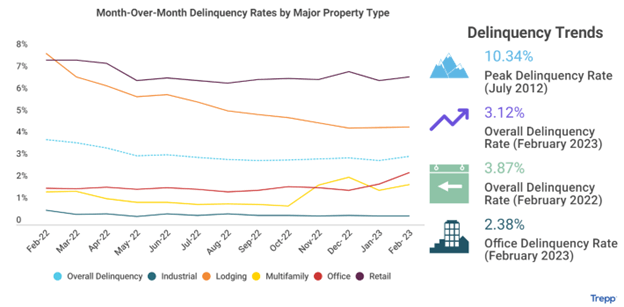
Third, let’s look at commercial real estate credit trends. Nearly everyone agrees that the banking system overall has minimal exposure to crypto and profitless tech troubles. However, with interest rates rising, real estate values falling, and banks highly levered to real estate values, rising loan delinquencies could signal oncoming banking distress.
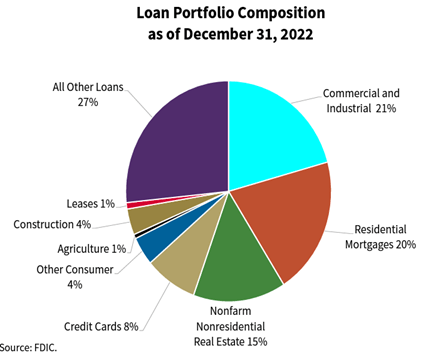
Fortunately, while rates have risen, most borrowers hold fixed-rate obligations well below today’s prevailing yields. While 30-year mortgages today charge nearly 7%, compare that with 4% a year ago and 3.0% two years ago. Given that nearly everyone bought or re-financed at fixed low rates, the surge higher in rates has less market effect than perceived. Furthermore, the no income/no job loans that preceded the GFC crisis do not exist today. Real estate owner equity levels sit far higher. While we will keep a close eye on real estate trends, at least for the moment, the downturn in prices and activity has not tripped distress wires. And in the end, it’s corporate profitability and mortgage repayment capability that underwrites the banking sector. Note that as a percentage of loans outstanding across all banks, crypto and venture capital don’t even register:
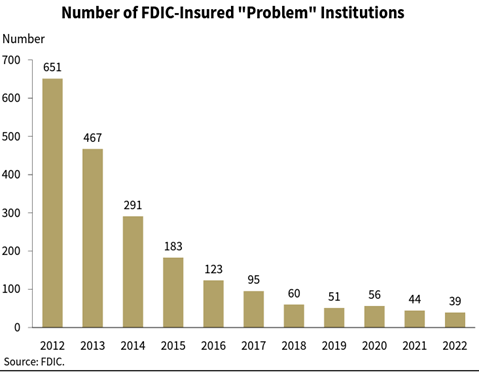
And as such, the number of banking institutions the FDIC monitors on the naughty list remains near cycle lows:
While we do not expect a wave of bank failures, banks will no longer get away with paying depositors nothing. Money Market Funds and T-Bills have quickly absorbed underpaid deposits, which does create liquidity issues for banks. Paying more to depositors than banks receive from borrowers will crimp profits and dissuade loan extensions. The Fed has worked hard to tighten financial conditions. The failure of Silvergate and Silicon Valley Bank may have done more to forward that agenda than an additional 0.25% rate hike later this month.
A year ago, I sat on a panel with lawyers and investment bankers in the turnaround industry. These specialists serve companies in distress at or near the point of bankruptcy. Sadly for them, they had no work at the time as the Government guaranteed all debt during the pandemic while shoveling money into the pockets of poor performers. Many of these providers had to close up shop or pivot into other vocations amidst the shrinking supply of distress:
By suppressing business distress, policymakers created a “moral hazard” of inflated business confidence leading to less scrutinous deal diligence and investor overconfidence. At the event, someone asked me if this largesse would cause another Great Financial Crisis. Not likely, I responded. The largest banks before the GFC figured out how to operate beyond the regulators’ reach by setting up an entire “shadow banking system” through derivatives. In response to the GFC, regulators tightened controls, significantly increased capital requirements, and frequently subjected the systematically important banks to stress tests. When cycles turn, it’s the unregulated areas of the marketplace that inflate and pop, with regulation close behind. So, while I didn’t expect another systematic financial inferno this go-round, I did expect brush fires amidst the “moral hazard” overgrowth. The largest unregulated bubbles blown since the GFC exist in cryptocurrency and venture capital. Over the past few weeks, two banks dedicated to these industries immolated. Silvergate Bank lent money to Crypto firms:
With the market cap of crypto down 75%, massive fraud and abuse scams unmasked, and support capital scarce, it’s a wonder Silvergate lasted this long!
On a larger scale, Silicon Valley Bank took in deposits from venture capital-backed technology startups and then lent money out to venture capital-backed technology startups. Since venture capital-backed technology start-ups rarely make money, they require a continuous flow of credit or equity to fuel operations. When the money stops flowing (no other lenders, venture capital frozen, IPO window closed), deposits evaporate. As companies run out of capital, valuations evaporate. The combination of a collapse in deposit levels and a collapse in collateral values forced Silicon Valley Bank to try and raise more capital, a white-hot distress flare for investors:
Unable to raise capital or forestall deposit runs, the FDIC was forced to step in and padlock the doors.
In short, overabundant capital, plus overconfidence in unregulated cryptocurrency and venture capital markets, led to misguided banking concentrations at Silvergate and Silicon Valley Bank, cueing the first bank failures since the COVID lockdowns in 2020:
The right question to ask now is, do these two rouge lenders signal a systematic crisis on approach, as the failure of Washington Mutual signaled in 2008? I don’t think so. Distress in crypto and venture doesn’t seem to have tripped distress warnings elsewhere. To assess systematic stress levels quickly, let’s look closely at credit spreads (the difference in yields between bond categories and risk-free treasuries). First, let’s look at moderate-risk corporate bond spreads:
In 2007, this spread shot higher from 1.5% to over 6% in short order. In 2020, this spread shot higher from 2% to 4% in short order. Today this spread sits at 1.79%, down from the 2.4% reached last summer. No signs of distress here.
Next, let’s look at high-yield/higher-risk corporate bond spreads:
In 2007, this spread shot higher from 2.5% to over 20% in short order. In 2020, this spread shot higher from 3% to 10% in short order. Today this spread sits at 4.3%, down from nearly 6% reached last summer. No signs of distress here.
Overall, corporate America shows no imminent signs of default.
Third, let’s look at commercial real estate credit trends. Nearly everyone agrees that the banking system overall has minimal exposure to crypto and profitless tech troubles. However, with interest rates rising, real estate values falling, and banks highly levered to real estate values, rising loan delinquencies could signal oncoming banking distress.
Fortunately, while rates have risen, most borrowers hold fixed-rate obligations well below today’s prevailing yields. While 30-year mortgages today charge nearly 7%, compare that with 4% a year ago and 3.0% two years ago. Given that nearly everyone bought or re-financed at fixed low rates, the surge higher in rates has less market effect than perceived. Furthermore, the no income/no job loans that preceded the GFC crisis do not exist today. Real estate owner equity levels sit far higher. While we will keep a close eye on real estate trends, at least for the moment, the downturn in prices and activity has not tripped distress wires. And in the end, it’s corporate profitability and mortgage repayment capability that underwrites the banking sector. Note that as a percentage of loans outstanding across all banks, crypto and venture capital don’t even register:
And as such, the number of banking institutions the FDIC monitors on the naughty list remains near cycle lows:
While we do not expect a wave of bank failures, banks will no longer get away with paying depositors nothing. Money Market Funds and T-Bills have quickly absorbed underpaid deposits, which does create liquidity issues for banks. Paying more to depositors than banks receive from borrowers will crimp profits and dissuade loan extensions. The Fed has worked hard to tighten financial conditions. The failure of Silvergate and Silicon Valley Bank may have done more to forward that agenda than an additional 0.25% rate hike later this month.
Pessimism continues to replenish after hotter-than-expected inflation reports accompany hotter-than-expected economic reports. After a fierce run-up from the October lows, the major stock indices sit right at major technical levels (50-day moving average, 200-day moving average) awaiting directional conviction. Preventing further advances, the entire interest rate complex has risen, as has the US dollar. Higher rates weigh on valuation mathematics, and a higher U.S. dollar weighs on earnings and sentiment mathematics. Fortunately, the run we had over the first six weeks of the year gave us plenty of room for retrenchment. Even with the sudden rise on the 10-year Treasury back above 4%…
…equity markets remain broadly higher on the year. And while 3% on the S&P 500 may not sound like much, when you annualize that number after only two months, it’s 19%. Outside of the S&P 500, returns rise even higher. Now that we have completed 17% of 2023, let’s do a quick survey to take stock of what’s working so far.
Smaller is Bigger
So far in 2023, the smaller companies have risen more than large companies…
…with the S&P 600 Small Cap index returning 8.2%, the S&P 400 Mid Cap index returning 7.5%, and the S&P 500 Large Cap Index returning 3.22%. We attribute this to a valuation reversion to the mean, which could persist for quite a while. The largest stocks in the S&P 500 became wildly over-owned and over-valued, with the five largest companies in the S&P 500 comprising 26% of the entire index value prior to 2022’s drop:
Today, they comprise about 21% of the S&P 500’s index value, well off their 2022 lows, but also well above the Top 5 weight prior to the dot-com reversion. When you compare P/E ratios, the S&P Small Cap index trades at 13.7x earnings; the S&P Mid Cap index trades at 14.2x earnings; the S&P 500 Large Cap index trades at 17.5x earnings, while the Mega-8 (Apple, Amazon, Google, Facebook, Microsoft, Netflix, Nvidia, Tesla) trade for 25.5x earnings. The outsized share of these few companies within the S&P 500 index primarily directs performance. If we compare valuations of the Small Cap index with these mega cap heavyweights, it trades for a 45% discount. This wide valuation disparity invites convergence, presenting small cap investors with ample scope for continued outperformance.
Value Stylin’
In 2022, the Value investment style, with its lower valuation attributes, dramatically outperformed the Growth style. In 2023, reweighting the factor indices has led to some confusion. In fact, mega caps like Google, Amazon, Facebook, and Microsoft now reside in both the growth and value factor indices after their sizable declines. This explains the near identical returns of the Value investment style and the Growth investment style year to date:
Another way to slice the data is to isolate the returns for the growth-iest of the growth and the value-iest of the value stocks. S&P provides these indices as well, calling them the Pure Style indices. The returns for the Pure Style indices year to date paint a much clearer picture with the S&P 500 Pure Value index up 4.8% versus the S&P 500 Pure Growth index up 1.1%. This divergence grows far larger down the cap spectrum, with the small cap S&P 600 Pure Value index up 13.6% and the small cap S&P 600 Pure Growth index up 5.8%. For 2023 so far, the value style continues to hold the advantage.
Offshore Returns
Last year, despite a strong run in the US dollar, war in Europe, and China COVID closures, international shares outperformed US shares by around 2%. Much of this can be attributed to the same “valuation return to the mean” that lifted small cap and international shares. In 2023, the dollar is flat, war still rages in Europe, and China’s economy has reopened. The valuation spread offshore remains compelling at 12.7x vs. 17.5x onshore. Therefore, the story for internationals has marginally improved, as have the returns:
The recent uplift in the US economy, interest rates, and the US dollar have lessened early-year outperformance, but any reversal in these factors will reignite return boosters offshore.
In sum, 2023 differs from 2022 in that it has produced gains. What hasn’t changed is the performance advantage for small caps, the value style, and offshore shares over US large cap stocks burdened by lofty valuations. This market continues to reward lower valuation market segments, which is why we continue to overweight them.
Extra Credit Chart 1: US Size and Style Performance:
Extra Credit Chart 2: USA vs. Ex. USA Valuations:
Enjoy your Sunday!
Sources: FactSet, yardeni.com, Standard and Poor’s, FRED
As expected, markets hit an air pocket after rallying strongly through the first six weeks of the year. With investor sentiment high as a spy balloon, it only took a few hotter-than-expected economic and inflation missiles to bring it down. That’s the irony of the market today. The market wants a mild recession because the Fed wants a mild recession. Without one, a stronger and more resilient economy goads the Fed into continually tightening policy, which increases the odds of a not-so-mild recession. So, perversely, positive economic surprises make for bad news. Note the following:
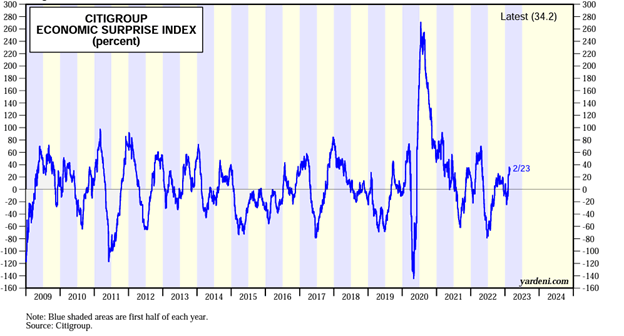
The Citigroup Economic Surprise index represents the sum difference between official economic results and forecasts. A number greater than zero conveys a period of better-than-expected economic data, while a number less than zero conveys a period of worse-than-expected economic data. Notice that from the 3rd quarter of last year into January of this year, the Surprise percentage fell from +20% to -20%. This corresponded with a near 20% advance in the S&P 500. However, over the past couple of weeks, the index has shot higher from -20% to +34%. While that’s great news for Main Street, it’s bad news for Wall Street. The surprising economic results drove the US dollar, interest rates and rate expectations higher, while driving sentiment, valuations, and stock market indices lower. But if the economy grows instead of shrinking, are we sure that’s bad?
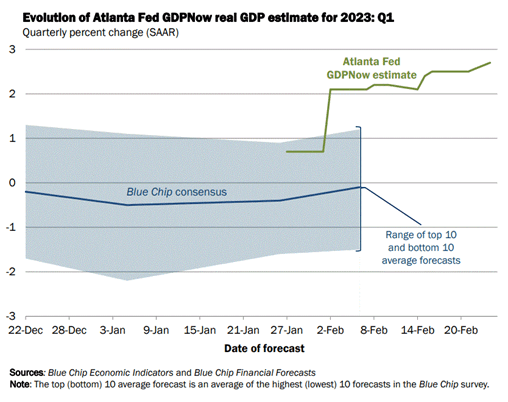
The Atlanta Fed updates its growth estimate for the current quarter with nearly every economic release. As expected, their forecast has risen as the positive economic surprises have risen:
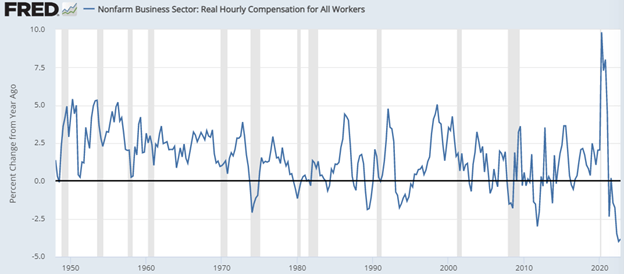
Per the Atlanta Fed’s estimate, the economy is on pace for a 2.7% growth rate in the first quarter compared with the Blue Chip economist’s flat to negative forecast for the quarter. This also follows a 2.7% GDP growth rate in the fourth quarter, hardly the stuff of recessions. Adding 6% inflation back to real GDP of 2.7% provides a nominal GDP growth rate of 8.7%. That rate better correlates with the corporate revenues opportunity as revenue and earnings reports do not subtract inflation. Therefore, more robust corporate revenues in the first quarter should ballast corporate earnings. If you haven’t hit your econ tolerance threshold yet, I have more. Headline inflation of 6% runs above wage inflation at 4%. That spread benefits corporations, not employees, further ballasting earnings.
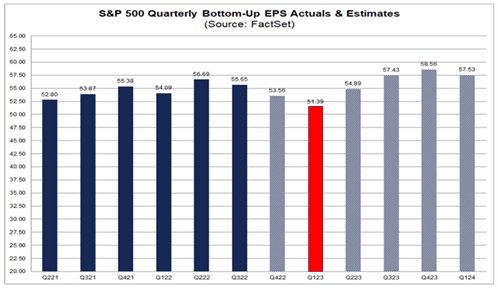
Therefore, the combination of stronger-than-expected economic data and headline inflation rates remaining above wage inflation rates suggests that economic and inflation surprises could translate into earnings surprises. Analysts currently expect Q1 revenues to grow an anemic 1.8% (consistent with the Blue Chip no growth forecasts) while earnings fall 5.7%, marking the lows for the year:
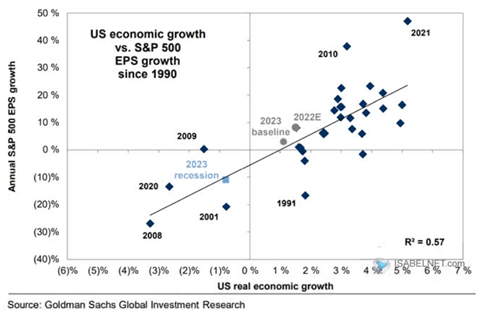
Should the economy remain resilient, this forecast either must roll forward or revert as earnings track the economy higher. Nothing is certain, but the correlation between GDP growth and earnings growth over the last 30 years makes a compelling case for upside surprise:
Surprising earnings growth either drives stock prices higher or stock valuations lower. Either way, the value proposition for investors improves.
Enjoy your Sunday!
Sources: Goldman Sachs Global Investment Research, FactSet, FRED, Blue Chip, Citigroup
As expected, markets hit an air pocket after rallying strongly through the first six weeks of the year. With investor sentiment high as a spy balloon, it only took a few hotter-than-expected economic and inflation missiles to bring it down. That’s the irony of the market today. The market wants a mild recession because the Fed wants a mild recession. Without one, a stronger and more resilient economy goads the Fed into continually tightening policy, which increases the odds of a not-so-mild recession. So, perversely, positive economic surprises make for bad news. Note the following:
The Citigroup Economic Surprise index represents the sum difference between official economic results and forecasts. A number greater than zero conveys a period of better-than-expected economic data, while a number less than zero conveys a period of worse-than-expected economic data. Notice that from the 3rd quarter of last year into January of this year, the Surprise percentage fell from +20% to -20%. This corresponded with a near 20% advance in the S&P 500. However, over the past couple of weeks, the index has shot higher from -20% to +34%. While that’s great news for Main Street, it’s bad news for Wall Street. The surprising economic results drove the US dollar, interest rates and rate expectations higher, while driving sentiment, valuations, and stock market indices lower. But if the economy grows instead of shrinking, are we sure that’s bad?
The Atlanta Fed updates its growth estimate for the current quarter with nearly every economic release. As expected, their forecast has risen as the positive economic surprises have risen:
Per the Atlanta Fed’s estimate, the economy is on pace for a 2.7% growth rate in the first quarter compared with the Blue Chip economist’s flat to negative forecast for the quarter. This also follows a 2.7% GDP growth rate in the fourth quarter, hardly the stuff of recessions. Adding 6% inflation back to real GDP of 2.7% provides a nominal GDP growth rate of 8.7%. That rate better correlates with the corporate revenues opportunity as revenue and earnings reports do not subtract inflation. Therefore, more robust corporate revenues in the first quarter should ballast corporate earnings. If you haven’t hit your econ tolerance threshold yet, I have more. Headline inflation of 6% runs above wage inflation at 4%. That spread benefits corporations, not employees, further ballasting earnings.
Therefore, the combination of stronger-than-expected economic data and headline inflation rates remaining above wage inflation rates suggests that economic and inflation surprises could translate into earnings surprises. Analysts currently expect Q1 revenues to grow an anemic 1.8% (consistent with the Blue Chip no growth forecasts) while earnings fall 5.7%, marking the lows for the year:
Should the economy remain resilient, this forecast either must roll forward or revert as earnings track the economy higher. Nothing is certain, but the correlation between GDP growth and earnings growth over the last 30 years makes a compelling case for upside surprise:
Surprising earnings growth either drives stock prices higher or stock valuations lower. Either way, the value proposition for investors improves.
Enjoy your Sunday!
Sources: Goldman Sachs Global Investment Research, FactSet, FRED, Blue Chip, Citigroup
Welcome to Superbowl weekend! The outcome of the matchup between the Philadelphia Eagles and the Kansas City Chiefs should hold great interest for football fans and investors alike. Historically, a win by the National Football Conference representative (Eagles) yields greater results than a win by the American Football Conference representative (Chiefs). Below are historical returns post-Superbowl:
The good news is that despite the outcome, markets tend to rise into year-end. Therefore, as a fan, root for whomever you prefer. But, for investors seeking higher returns, please root for the Philadelphia Eagles.
Fly, Eagles, Fly!
Rally Respite
January’s 6% return for the S&P 500 marked the strongest first month of the year since 2019, with the S&P 500 returning 8% that January. In 2019, the gains continued, with the S&P 500 closing up 30% by year’s end. While we remain optimistic for 2023, a 30% plus return seems somewhat unlikely. However, based on the often-referenced January Indicator, a strong January does have predictive value:
Over the last 50 years, January gains occurred 27 times. Ninety percent of those years ended positively, with the S&P up 20%, on average. However, when we add in negative performance from the previous year, the numbers become even more compelling:
Gains of more than 5% in January, after a year of negative returns, drive full-year returns to +30%, on average. So, while the January Indicator has an encouraging record, the combination of poor prior-year performance with strong January performance adds even more investor enthusiasm! Herein lies the problem.
As Warren Buffett quipped in 1987, “in the short term, the market is a voting machine, but in the long term, it’s a weighing machine.” Therefore, readings on market sentiment provide more reliable forecasts over shorter periods than fundamental readings. Over longer periods, the fundamental readings matter more. Those who follow our content will recognize that whenever I seek short-term trend guidance, I look to the state of retail investor sentiment. There are many available gauges on offer, but CNN’s Fear & Greed composite offers a good quick read:
At the current moment, January’s strong returns, after last year’s weak returns, have driven investor optimism to its highest level since late 2021. This does not suggest that markets stand poised to repeat 2022’s dismal performance, but it does indicate that a rally respite seems appropriate. Historically, February is the second weakest month of the year, with the second half of February dragging the most. Given the rapid move in sentiment from fear to greed over the past month, and the record volume of short covering pressing indices higher, this market needs to regroup and find fundamental reasons to rally further.
Fundamental Favor
The January jobs report surprised observers with its strength. Unemployment hit 3.4% in the US, its lowest level since 1969. Fortunately, average hourly earnings in January also fell, despite the surge in employment. This led Chairman Powell to recognize the “disinflationary” trend in a recent speech, surprising markets further. The combination of better-than-expected economic data amidst disinflationary trends seemingly defies economic logic. Adherents to the “Phillips Curve” orthodoxy that employment levels drive inflation levels seem incredulous at best and agitated at worst. In their vernacular, lower unemployment should drive higher inflation, and yet, it hasn’t:
Looking back, after the Great Financial Crisis, economic recovery drove inflation higher while the economy regained its productive footing. By mid-2011, inflation ran at 3.6%, even with unemployment of 9%. After a decade of economic recovery, inflation fell to 2.3%, while unemployment fell to 3.5%. Therefore, over the term of the most recent economic recovery cycle, inflation fell alongside unemployment. Post-COVID, the economic results have been greatly amplified due to the rapid collapse and the record policy response. Inflation surged far higher, and unemployment levels fell far faster. However, as the economy now normalizes, the Phillips Curve fallacy has reappeared. Inflation peaked in June at 9%, with unemployment at 3.6%. Since then, inflation has fallen toward 6% while unemployment has fallen even further to 3.4%. While the Phillip Curvians at the Federal Reserve have Powell’s attention, the data trends may have stoked Powell’s skepticism. This would explain the disconnect between the stronger-than-expected jobs report and Powell’s weaker-than-expected policy guidance. Chairman Powell may prove more independently-minded and pragmatic than expected. Removal of the Phillips Curve filter removes the recession requirement to combat inflation. And that’s a fundamental truth worth rallying over.