In January, the launch of Trump’s second term brought bold promises but also the challenges of high interest rates, tariff policy, and inflation risk:
Then: “Trump had his ‘return to glory’ last week, but this week the focus will shift to Jerome Powell’s response to Trump’s demand on interest rates. The Fed will convene on January 28–29th… Powell will surely not budge at the President’s call for lowering interest rates.”
Now: What began as a quiet standoff has turned into a headline-grabbing feud. Trump now calls him “Too Late Powell.” While rates remain elevated, the tug-of-war between pro-growth policy goals and Fed caution has defined much of the year’s narrative. I couldn’t dream of a better picture to come back then!
Back in March, the market hit its first technical correction since 2022, shaking investor confidence but also opening the door for opportunity:
Then: “The S&P 500 has experienced a 10% correction… In the short term, they serve as a reset for market structure, volatility, and valuations. More importantly, corrections create opportunities for those with cash on the sidelines and for investors who are dollar-cost averaging into equities.”
Now: The S&P500 roars back, up roughly 30% from the lows of April 8th to new all-time highs this week, rewarding those who “avoided panic and strategically invested their cash.”
Earlier in the year, record-setting corporate share repurchases provided a notable undercurrent of support for equity markets:
Then: “Corporate share buyback announcements hit record highs in Q1 2025… These supportive equity flows… signal management team confidence… You can call it a buyback or financial engineering, but it’s just math, and buybacks are naturally supportive of equity prices, ultimately benefiting investors.”
Now: The buyback wave has only accelerated! 2025 is on pace to hit $1.1 trillion in repurchases, surpassing the 2022 record. Meanwhile, markets are at all-time highs, providing a steady tailwind despite volatility in policy headlines.
The first half of 2025 have reminded us that markets are a constant push and pull of policy, sentiment, and structural forces. The Powell–Trump rate standoff, the recovery from the March correction, and the record pace of buybacks all tell the same story: investors who kept their cool and stayed the course were rewarded. Looking back on my insights then, and now, provides an opportunity to refine perspective, challenge assumptions, and provide clarity!
Have a great week!
-David
Sources: YCharts; Birinyi Associates
This communication and its contents are for informational and educational purposes only and should not be used as the sole basis for any investment decision. The information contained herein is based on publicly available sources believed to be reliable but is not a representation, expressed or implied, as to the accuracy, completeness, or correctness of said information. References to political figures or policies are for informational purposes only and do not represent an endorsement by Waddell & Associates. Any forward-looking statements reflect current opinions and assumptions and are subject to change without notice; actual results may differ materially. Past performance does not guarantee future results. Waddell & Associates may use artificial intelligence tools to help generate or summarize content; all outputs are reviewed by our team for accuracy and relevance.
While job growth has maintained loft, real disposable personal income gains have fallen towards levels more consistent with slower economic growth as wage pressures abate. Tariff price adjustments reduce real disposable personal incomes as would any reductions in government benefits. However, real disposable personal income also includes tax payments. Any reduction in tax rates would thereby boost real disposable personal income and spending capacity for consumers. While tariffs may reduce spending power, tax cuts increase it. While economists expect tariffs to subtract less than .5% from GDP next year, they also expect the tax cuts to add over 1% to GDP.
Perhaps this explains why markets are trading at all-time highs.
Enjoy the rest of your weekend!
-David
Sources: Yardeni, Federal Reserve Bank of St. Louis, Reuters
This communication and its contents are for informational and educational purposes only and should not be used as the sole basis for any investment decision. The information contained herein is based on publicly available sources believed to be reliable but is not a representation, expressed or implied, as to the accuracy, completeness, or correctness of said information. References to political figures or policies are for informational purposes only and do not represent an endorsement by Waddell & Associates. Any forward-looking statements reflect current opinions and assumptions and are subject to change without notice; actual results may differ materially. Past performance does not guarantee future results. Waddell & Associates may use artificial intelligence tools to help generate or summarize content; all outputs are reviewed by our team for accuracy and relevance.
…and indeed, it has! We haven’t received the March data yet, but in February, the US imported $400 billion of foreign stuff. As a result, the trade deficit year-to-date (imports minus exports) has expanded 86% compared with the same period last year. Unfortunately, these tariff distortions weigh heavily on GDP as higher trade deficits subtract from GDP calculations. According to the Fed’s GDPNow calculation, first-quarter GDP could be negative overall. Other real-time projections aren’t as dire, but they are not good:
While trade distortions will drag on first quarter GDP, overall consumer, government, and corporate spending remained firm. US retail sales hit a record in March, seeing their biggest monthly gain since January of 2023. However, the purchases appear to suggest consumers were front-running tariffs as well, with auto purchases up 5.3% month-over-month as an example. Overall, consumer activity should contribute nearly 1% to Q1 GDP growth. While DOGE cuts gain headlines, the US Government has not lowered spending overall. In fact, so far this year, the Federal Government has spent $140 billion more than this time last year. This will likely yield a contribution of .3% or so to first quarter GDP growth. Lastly, while business sentiment has deteriorated, first quarter business investment remained resolute with industrial production higher compared with this time last year. Therefore, the story of Q1 for the US economy will be that the tariff front-running surge in imports detracted from GDP while consumer, business, and government spending kept us afloat. But with the tariffs in force, imports should collapse, leaving the direction of GDP largely up to consumers.
High-frequency economic data for April isn’t very encouraging. Freight volumes have collapsed. Airlines have provided negative guidance, reduced capacity, and lower fares. Consumer juggernauts, like Chipotle, have reported lower same-store sales, and job openings within leisure and hospitality sectors have declined. According to the Fed’s Beige Book—a compilation of anecdotal economic research—the use of the words “tariffs,” “uncertainty,” “cuts,” and “layoffs” surged in the last report:
This does not portend well for consumer and business activity in the second quarter… unless Trump starts making trade deals!
How Long Do Trade Deals Take?
Despite Trump’s 90 in 90-day forecast, trade negotiations between the US and other countries typically take about 18 months, on average:
This week, Treasury Secretary Bessent suggested talks with the Chinese had already begun. Markets rallied strongly on the report. Unfortunately, the Chinese didn’t corroborate and explicitly denied that any talks had occurred. Furthermore, they have indicated that talks wouldn’t occur until Trump removes his bilateral tariffs. High hopes for a trade deal with Japan also fizzled this week as a three-day stand at the White House ended without any triumphant press releases. Another attempt is on the books for later this month, but the Japanese have not indicated any trade deals are imminent. If other nations do not change their positions, Trump may have to change his stance in reaction to upcoming price hikes and supply shortages. Look for “hard” economic data incoming to start catching up with the “soft” economic data plumbing recessionary lows. Unlike the COVID pandemic, where antidotes had to be developed and broadly administered in tents with syringes, the cure for the tariff pandemic only requires a pen and an executive order. Now that economic fears are becoming fact, the pressure for a cure is mounting.
Extra Credit
My favorite chart of the week, how the S&P performs when Bessent speaks vs. Lutnick or Navarro, is reminiscent of our last slide in last week’s Live edition:
Have a great weekend!
-David
This communication and its contents are for informational and educational purposes only and should not be used as the sole basis for any investment decision. The information contained herein is based on publicly available sources believed to be reliable but is not a representation, expressed or implied, as to the accuracy, completeness, or correctness of said information. Past performance does not guarantee future results.
Sources: FRED, CapitalSpectator.com, Bloomberg, PIIE, Apollo Chief Economist, Bespoke Media
In 2022, Liz Truss became Prime Minister of the United Kingdom. Truss soon after introduced a “mini-budget” that included unfunded tax cuts and unrealistic borrowing plans. This profligacy triggered financial market chaos. The pound plummeted and Gilt interest rates surged. The Bank of England had to intervene to stabilize the market. Truss resigned 44 days later. While Trump appears willing to endure recession and a stock market rout, he does not appear willing to endure higher Treasury yields, the fulcrum for his Wednesday tariff retreat. Companies use the stock market to fund operations. The US Government uses the Treasury market. Higher yields become highly problematic for funding the Trump agenda and represent a low confidence vote in his policies and American fiscal stability. Trump simply cannot afford, and Bessent cannot survive, runaway Treasury yields. For heads of state, higher yields lead to higher concessions.
Stick to the Plan
As outlined in this year’s Outlook, we expected Trump’s tariff campaign would generate volatility and limit upside a la 2018. We positioned our portfolios accordingly. Unfortunately, the scale of his actions to date swamped everyone’s forecasts, including ours. However, our playbook hasn’t changed. First, solid financial planning produces dependable asset allocations. Our clients’ long-term asset allocations contemplate short-term bouts of volatility. Asset allocations should only change if you experience a major personal change (job loss, health events, financial windfalls etc.) that would materially impact your long-run planning. Additionally, while your equities may be down, your cash, bonds, real estate, etc. are not. Your net worth may shift with the market, but the impact is often smaller than the swings themselves. Stay committed to your asset allocations. Second, use market volatility to generate tax losses. Earlier this week we sold a position and reinvested the proceeds in a similar position to book tax losses. We will continue doing this as opportunity arises, making lemonade out of lemons. Lastly, in a sentiment driven market we encourage adding cash at pessimistic extremes. We reached one such extreme earlier this week, and despite the start of a historic global trade war, the S&P 500 closed the week higher. Remember that investment returns equal reality minus expectations. It doesn’t matter if reality is horrendous, as long as it’s better than expected!
Volatility is Opportunity
The following chart chronicles stock market returns following similar moments of extreme volatility since 1990:
Note that investing in high volatility markets proves far more profitable over time than investing in low volatility markets. High volatility markets force short-term traders to sell indiscriminately to cover margin calls or unwind impaired strategies. Long-term investors have a time arbitrage opportunity to take advantage of forced mis-pricings. Historically, when traders are sellers, investors should be buyers.
Have a great weekend!
-David
Sources: Creative Planning, @CharlieBilello
This communication and its contents are for informational and educational purposes only and should not be used as the sole basis for any investment decision. The information contained herein is based on publicly available sources believed to be reliable but is not a representation, expressed or implied, as to the accuracy, completeness, or correctness of said information. Past performance does not guarantee future results.
At its peak employment, the US manufacturing sector employed 19.5 million Americans. Today that number has fallen to 12.8 million Americans. However, the value of US manufacturing output hasn’t declined since 1979; it has increased substantially. In 1979, the US manufacturing sector contributed $500 billion to the US economy. Today, manufacturing contributes $3 trillion to the US economy. How do you get more output with fewer workers? By increasing worker productivity.
Developing worker productivity and increasing GDP per capita is the core objective of economic growth. As economies develop, they become more sophisticated and shift from mining and agriculture (Africa) to manufacturing (China) to services and consumption (USA). Since their inclusion into the WTO, the ascension of China’s manufacturing capacity has not only displaced US manufacturing share, but everyone else’s as well:
This is because it has been so cheap and effective to make things in China. American manufacturing workers cost five times as much as Chinese manufacturing workers. This explains why Trump reserved his highest tariff rate of 54% for China (and China proxies like Cambodia, Laos, and Vietnam). However, recognize that even with its manufacturing dominance, China’s GDP per capita is $13,000, compared to $70,000 for citizens of the United States. They make more stuff, but we make more money. Will all these tariffs lead to a renaissance in US manufacturing output? Perhaps, if they remain at high levels for an extended period and foreign direct investments pour into the USA, as advertised. Will the tariffs lead to a renaissance in US employment? Unlikely, as AI mixed with dexterous robotics creates virtual workers that “steal our jobs” right here at home.
Make Budgets Balance Again!
Trump suggested throughout his campaign that he could eliminate the $2 trillion annual fiscal deficit through tariffs and DOGE cost savings. We currently import roughly $3.5 trillion worth of goods. Therefore, math suggests a 28% tariff would produce $1 trillion in tax revenue. That assumes, of course, that counter-tariffs, retaliatory actions, and economic contractions don’t interfere with collections, but I digress. As of Wednesday’s announcement, Trump has lifted the effective import tariff rate to 22% with more in the pipeline (copper, lumber, semis, pharmaceuticals) to get us closer to 28%.
If tariffs can generate $1 trillion in revenue and DOGE can deliver on its claim, “Yeah, I mean, unless we’re stopped, we will get to a trillion dollars of savings,” the deficit gets eliminated. Although the $1 trillion in fiscal contraction would subtract 3.33% from our $30 trillion GDP overall, requiring growth offsets to maintain income and tax receipt levels.
Trump has discussed additional tax cuts, in addition to extending his expiring tax cuts and deregulation, as a stimulus offset. Unfortunately, growth-stoking stimulus is deficit-stoking as well. Trump’s efforts to balance the budget through higher tariffs and fiscal contraction increase recession odds, which increases deficit odds. To reduce deficits effectively and consistently, Washington must have the courage to restructure and reduce Medicaid, Medicare, and Social Security. Tariffs and DOGE work to eliminate the deficit with simple math, but the unintended consequences of these major policies will not be simple.
Make America Export Again!
Just to level set, the US is the world’s largest goods importer at $3 trillion and the second largest goods exporter at $2 trillion. This leaves us with a $1 trillion trade deficit, largely a function of two things primarily. First, we are the wealthiest nation on the planet by far, with a $30 trillion GDP, 50% higher than second-place China, providing us with massive purchasing demand to be satiated. Second, we have the most overvalued currency in the world thanks to US exceptionalism and our currency reserve status. Nonetheless, Trump has simply stylized our overall trade deficit as cheating. He quantified the amount we are being “ripped off” by each trading partner by dividing our trade deficit with each country by our imports from them. For example, we run a $123 billion trade deficit with Vietnam. We import $136 billion in goods from them. Dividing $123 billion into $136 billion derives a 90% “rip off” rate. To be “nice”, Trump only applied half of this rate as the reciprocal tariff. Therefore, to motivate Vietnam to eliminate its trade imbalance with the US, Trump placed a 46% tariff on all imports from Vietnam. Vietnam’s actual tariff rate on US imports is 5.1%. Therefore, true reciprocity would require that the US charge 5.1% on imports from Vietnam. Instead, we will be charging 46% to recoup half of the “rip off”. Unfortunately, seeking to eliminate trade imbalances with each trading partner isn’t feasible. Vietnam imports about $350 billion overall. That number includes $150 billion in computers, electronics, cell phones, and components from China. Commodities account for most of the remainder of the value. The $13 billion in Vietnam imports from the United States includes $4 billion in advanced manufacturing components, $1 billion in aircraft, spacecraft, and specialty equipment, and $500 million in pharmaceuticals—cotton, plastics, animal feed, chemicals, and petroleum account for the rest. To nullify the trade imbalance, Vietnam needs to spend ten times the amount on US exports as it does today, moving our import share from 3.7% to 37%. Simple enough, we just need to quickly start producing the lowest cost consumer electronics in the world. Take that, China!
Best Guess
So, what is really going on here? It’s highly unlikely that the US will challenge China as the world’s manufacturer. Even at China’s breakneck pace, it took decades for them to build up the capacity they have today. Furthermore, the US cannot compete with developing nations as the world’s lowest cost manufacturer. Additionally, modern manufacturing uses more robots than people, making the jobs argument dubious. Lastly, no one will make a long-duration, large-scale investment decision based upon an executive order from a President with a plummeting approval rating.
The re-industrialization of America argument and the deficit elimination arguments feel contrived. However, the deficit reduction argument has potential, but not at 28% tariff levels. These levels likely trigger a recession, and recessions expand deficits. The world can likely absorb the 10% statutory rate, and that would contribute significantly to deficit reduction. However, to extend Trump’s tax cuts and eliminate even more, he needs to show more revenue than that. (Those deep into the mechanics will note that since Trump used executive orders to impose the tariffs rather than the legislative process, they don’t apply to the reconciliation. To that I say, majorities have their privileges).
Trump needs roughly $5 trillion in deficit reduction strategies to pass his tax cut agenda. If he can demonstrate the ability to harvest that amount from tariffs, he might get the tax cuts through. Once that happens, he could begin reducing and eliminating the reciprocal tariffs, relying on newly stimulated GDP growth for deficit reduction. Not saying that’s his plan, but it is a plan, and one that could have the economy kicking entering the mid-terms. My only other explanation is that he plans to have a “Mar-A-Lago Accord” resembling the “Plaza Accord” in 1985, which devalued the US dollar by 50% against the Yen and the Mark. I’ll introduce that concept here, but I am not there yet.
In conclusion, I feel like this chaos is a classic Trump setup – either for budget negotiations, currency devaluation, or something, I am just not seeing yet.
What Investors Should Do
Selling into this environment may feel correct, but history demonstrates it’s usually incorrect. For long-term investors, selling out today requires buying back in on another day when things feel safer. But remember that buying at peak pessimism levels proves most profitable. Good feelings lead to lower returns, the thesis of our 2025 Outlook. At this point, the decision to de-risk needs to have already been made. From here, it’s possible to harvest tax losses, redeploy the cash, and put fresh cash to work, patiently, at pessimistic extremes. This is a tradeable market, but trying to time Trump isn’t a viable strategy.
Have a great weekend!
-David
Sources: FRED, Financial Times, LSEG, Capital Economics, World Bank, Statista
This communication and its contents are for informational and educational purposes only and should not be used as the sole basis for any investment decision. The information contained herein is based on publicly available sources believed to be reliable but is not a representation, expressed or implied, as to the accuracy, completeness, or correctness of said information. Past performance does not guarantee future results.
" class="link-chevron">
Watch Now
Earlier this year, we shared our 2025 Outlook presentation entitled, “That’s the Spirit! How the Revival of Animal Spirits will Impact Economies and Markets in 2025.” We defined Animal Spirits as the instinctive, emotional, and psychological factors that influence economic activity beyond rational decision-making. High Animal Spirits result in risk-seeking behavior, while low Animal Spirits result in risk-avoidant behavior. Typically, when Animal Spirits run hot, future market returns tend to cool as reality undershoots lofty expectations. This informed our forecast for lukewarm stock market performance this year. But just as high expectations present a problem, low expectations present an opportunity. At the moment, animal spirits and expectations have collapsed as Trump’s tariff threats have surged. The following pictures say 1,000 words. I promise I’ll only say 600 to make sense of them.
March consumer confidence dropped to the lowest level since January of 2021. Feelings about current conditions weren’t so bad, but feelings about future conditions were terrible!
As future economic expectations collapsed, so have future stock market return expectations. In fact, the percentage of investors who expect the S&P 500 to rise over the next 12 months fell from nearly 60% at year-end to 37% today. That’s the largest decline in investor expectations over two months EVER!
And it’s not just consumers feeling “tariffied”, it’s business leaders as well. CEOs tasked with making strategic decisions within a chaotic policy environment have lost faith at an historic rate:
CEO confidence levels haven’t fallen this low since shortly after the Great Financial Crisis, with the current readings the lowest since COVID. In November, 65% of CEO’s expected business conditions to improve over the coming year, compared with just 39% today. As one respondent commented within the survey:
“Deeply concerned about the impact of tariffs and other disruptions to traditional global supply chains and trade alliances,” said one CEO who says his organization is now less bullish on growth initiatives and more on preventing the downside impact of the new trade policies.
“Tariffied” Economists
Coming into the year, none of the major economic forecasting firms called for a recession. Economists expected that the combination of historic household net worths, historic household incomes, historic corporate net worths, and historic corporate profits would support consumer spending, continued payroll additions, and productivity enhancing capital expenditures. The initiation of tariff tirades, and Trump’s willingness to withstand economic weakness as the economy “transitions,” have greatly increased potential recession odds:
Analysts have trimmed their profit expectations for the S&P 500 by 3-4% in recognition of tariff impacts. Remember that someone must pay the tariff. The exporter, the importer, the retailer, and the consumer will all share the burden. Goods that are more commoditized place more burden on the seller, while goods that are specialized will place more burden on the buyer. As Ronald Reagan quipped, “If you want less of something, tax it.” Tariffs tax commerce. Less commerce cleanly translates into less corporate earnings:
The Fed may have left interest rates unchanged at their meeting last week, but they did not leave forecasts unchanged. In their summary of economic projections, they increased inflation expectations while decreasing their growth expectations. Economists call this indicator conflict… stagflation:
Trump will reveal his tariff strategy on April 2nd, a day he now refers to as “Liberation Day”. While no one knows exactly what Trump will say, three potential strategies hold contention. First, tariffs could be used to plug the deficit hole. If DOGE can cut a trillion, and a 25% tariff on all imports can provide a trillion in revenues, voila, the budget balances! Second, the tariffs could be used to re-industrialize the United States of America. US-based manufacturing currently represents 10% of US GDP, compared to 25% in the 1970s and 27.5% in China today. Wouldn’t it be great if we made all our own cars again? Third, the tariffs could be used to bully the “Dirty Fifteen” into lowering their tariffs on American-made goods. Trump cited the offenders listed below:
Each of these nations tariffs US imports at some level. Further opening these markets to US exporters would help improve the trade deficit, increase US manufacturing, and support GDP growth.
Most likely, the tariffs simply become a tool of statecraft and rather than apply blindly to all our trade partners, they will be used to extract concessions like border security, defense spending, US import commitments, currency adjustments, and tax reforms. But, if Trump speaks more about using tariffs to reduce or eliminate tariffs with trading partners (already in the works with India), this pessimistic and oversold market will surge.
I leave you with one more chart that details forward returns for the S&P 500 following previous sharp, sentiment-driven corrections. Remember, Trump prefers to be loved… and Trump would also prefer to win the mid-term elections. While few expect it, and the market is positioned against it, Trump may just use “Liberation Day” to liberate the bulls!
This communication and its contents are for informational and educational purposes only and should not be used as the sole basis for any investment decision. The information contained herein is based on publicly available sources believed to be reliable but is not a representation, expressed or implied, as to the accuracy, completeness, or correctness of said information. Past performance does not guarantee future results.
">
March 29, 2025
Earlier this year, we shared our 2025 Outlook presentation entitled, “That’s the Spirit! How the Revival of Animal Spirits will Impact Economies and Markets in 2025.” We defined Animal Spirits as the instinctive, emotional, and psychological factors that influence economic activity beyond rational decision-making. High Animal Spirits result in risk-seeking behavior, while low Animal Spirits result in risk-avoidant behavior. Typically, when Animal Spirits run hot, future market returns tend to cool as reality undershoots lofty expectations. This informed our forecast for lukewarm stock market performance this year. But just as high expectations present a problem, low expectations present an opportunity. At the moment, animal spirits and expectations have collapsed as Trump’s tariff threats have surged. The following pictures say 1,000 words. I promise I’ll only say 600 to make sense of them.
March consumer confidence dropped to the lowest level since January of 2021. Feelings about current conditions weren’t so bad, but feelings about future conditions were terrible!
As future economic expectations collapsed, so have future stock market return expectations. In fact, the percentage of investors who expect the S&P 500 to rise over the next 12 months fell from nearly 60% at year-end to 37% today. That’s the largest decline in investor expectations over two months EVER!
And it’s not just consumers feeling “tariffied”, it’s business leaders as well. CEOs tasked with making strategic decisions within a chaotic policy environment have lost faith at an historic rate:
CEO confidence levels haven’t fallen this low since shortly after the Great Financial Crisis, with the current readings the lowest since COVID. In November, 65% of CEO’s expected business conditions to improve over the coming year, compared with just 39% today. As one respondent commented within the survey:
“Deeply concerned about the impact of tariffs and other disruptions to traditional global supply chains and trade alliances,” said one CEO who says his organization is now less bullish on growth initiatives and more on preventing the downside impact of the new trade policies.
“Tariffied” Economists
Coming into the year, none of the major economic forecasting firms called for a recession. Economists expected that the combination of historic household net worths, historic household incomes, historic corporate net worths, and historic corporate profits would support consumer spending, continued payroll additions, and productivity enhancing capital expenditures. The initiation of tariff tirades, and Trump’s willingness to withstand economic weakness as the economy “transitions,” have greatly increased potential recession odds:
Analysts have trimmed their profit expectations for the S&P 500 by 3-4% in recognition of tariff impacts. Remember that someone must pay the tariff. The exporter, the importer, the retailer, and the consumer will all share the burden. Goods that are more commoditized place more burden on the seller, while goods that are specialized will place more burden on the buyer. As Ronald Reagan quipped, “If you want less of something, tax it.” Tariffs tax commerce. Less commerce cleanly translates into less corporate earnings:
The Fed may have left interest rates unchanged at their meeting last week, but they did not leave forecasts unchanged. In their summary of economic projections, they increased inflation expectations while decreasing their growth expectations. Economists call this indicator conflict… stagflation:
Trump will reveal his tariff strategy on April 2nd, a day he now refers to as “Liberation Day”. While no one knows exactly what Trump will say, three potential strategies hold contention. First, tariffs could be used to plug the deficit hole. If DOGE can cut a trillion, and a 25% tariff on all imports can provide a trillion in revenues, voila, the budget balances! Second, the tariffs could be used to re-industrialize the United States of America. US-based manufacturing currently represents 10% of US GDP, compared to 25% in the 1970s and 27.5% in China today. Wouldn’t it be great if we made all our own cars again? Third, the tariffs could be used to bully the “Dirty Fifteen” into lowering their tariffs on American-made goods. Trump cited the offenders listed below:
Each of these nations tariffs US imports at some level. Further opening these markets to US exporters would help improve the trade deficit, increase US manufacturing, and support GDP growth.
Most likely, the tariffs simply become a tool of statecraft and rather than apply blindly to all our trade partners, they will be used to extract concessions like border security, defense spending, US import commitments, currency adjustments, and tax reforms. But, if Trump speaks more about using tariffs to reduce or eliminate tariffs with trading partners (already in the works with India), this pessimistic and oversold market will surge.
I leave you with one more chart that details forward returns for the S&P 500 following previous sharp, sentiment-driven corrections. Remember, Trump prefers to be loved… and Trump would also prefer to win the mid-term elections. While few expect it, and the market is positioned against it, Trump may just use “Liberation Day” to liberate the bulls!
This communication and its contents are for informational and educational purposes only and should not be used as the sole basis for any investment decision. The information contained herein is based on publicly available sources believed to be reliable but is not a representation, expressed or implied, as to the accuracy, completeness, or correctness of said information. Past performance does not guarantee future results.
">Why So “Tariffied”?
Earlier this year, we shared our 2025 Outlook presentation entitled, “That’s the Spirit! How the Revival of Animal Spirits will Impact Economies and Markets in 2025.” We defined Animal Spirits as the instinctive, emotional, and psychological factors that influence economic activity beyond rational decision-making. High Animal Spirits result in risk-seeking behavior, while low Animal Spirits result in risk-avoidant behavior. Typically, when Animal Spirits run hot, future market returns tend to cool as reality undershoots lofty expectations. This informed our forecast for lukewarm stock market performance this year. But just as high expectations present a problem, low expectations present an opportunity. At the moment, animal spirits and expectations have collapsed as Trump’s tariff threats have surged. The following pictures say 1,000 words. I promise I’ll only say 600 to make sense of them.
March consumer confidence dropped to the lowest level since January of 2021. Feelings about current conditions weren’t so bad, but feelings about future conditions were terrible!
As future economic expectations collapsed, so have future stock market return expectations. In fact, the percentage of investors who expect the S&P 500 to rise over the next 12 months fell from nearly 60% at year-end to 37% today. That’s the largest decline in investor expectations over two months EVER!
And it’s not just consumers feeling “tariffied”, it’s business leaders as well. CEOs tasked with making strategic decisions within a chaotic policy environment have lost faith at an historic rate:
CEO confidence levels haven’t fallen this low since shortly after the Great Financial Crisis, with the current readings the lowest since COVID. In November, 65% of CEO’s expected business conditions to improve over the coming year, compared with just 39% today. As one respondent commented within the survey:
“Deeply concerned about the impact of tariffs and other disruptions to traditional global supply chains and trade alliances,” said one CEO who says his organization is now less bullish on growth initiatives and more on preventing the downside impact of the new trade policies.
“Tariffied” Economists
Coming into the year, none of the major economic forecasting firms called for a recession. Economists expected that the combination of historic household net worths, historic household incomes, historic corporate net worths, and historic corporate profits would support consumer spending, continued payroll additions, and productivity enhancing capital expenditures. The initiation of tariff tirades, and Trump’s willingness to withstand economic weakness as the economy “transitions,” have greatly increased potential recession odds:
Analysts have trimmed their profit expectations for the S&P 500 by 3-4% in recognition of tariff impacts. Remember that someone must pay the tariff. The exporter, the importer, the retailer, and the consumer will all share the burden. Goods that are more commoditized place more burden on the seller, while goods that are specialized will place more burden on the buyer. As Ronald Reagan quipped, “If you want less of something, tax it.” Tariffs tax commerce. Less commerce cleanly translates into less corporate earnings:
The Fed may have left interest rates unchanged at their meeting last week, but they did not leave forecasts unchanged. In their summary of economic projections, they increased inflation expectations while decreasing their growth expectations. Economists call this indicator conflict… stagflation:
Trump will reveal his tariff strategy on April 2nd, a day he now refers to as “Liberation Day”. While no one knows exactly what Trump will say, three potential strategies hold contention. First, tariffs could be used to plug the deficit hole. If DOGE can cut a trillion, and a 25% tariff on all imports can provide a trillion in revenues, voila, the budget balances! Second, the tariffs could be used to re-industrialize the United States of America. US-based manufacturing currently represents 10% of US GDP, compared to 25% in the 1970s and 27.5% in China today. Wouldn’t it be great if we made all our own cars again? Third, the tariffs could be used to bully the “Dirty Fifteen” into lowering their tariffs on American-made goods. Trump cited the offenders listed below:
Each of these nations tariffs US imports at some level. Further opening these markets to US exporters would help improve the trade deficit, increase US manufacturing, and support GDP growth.
Most likely, the tariffs simply become a tool of statecraft and rather than apply blindly to all our trade partners, they will be used to extract concessions like border security, defense spending, US import commitments, currency adjustments, and tax reforms. But, if Trump speaks more about using tariffs to reduce or eliminate tariffs with trading partners (already in the works with India), this pessimistic and oversold market will surge.
I leave you with one more chart that details forward returns for the S&P 500 following previous sharp, sentiment-driven corrections. Remember, Trump prefers to be loved… and Trump would also prefer to win the mid-term elections. While few expect it, and the market is positioned against it, Trump may just use “Liberation Day” to liberate the bulls!
This communication and its contents are for informational and educational purposes only and should not be used as the sole basis for any investment decision. The information contained herein is based on publicly available sources believed to be reliable but is not a representation, expressed or implied, as to the accuracy, completeness, or correctness of said information. Past performance does not guarantee future results.


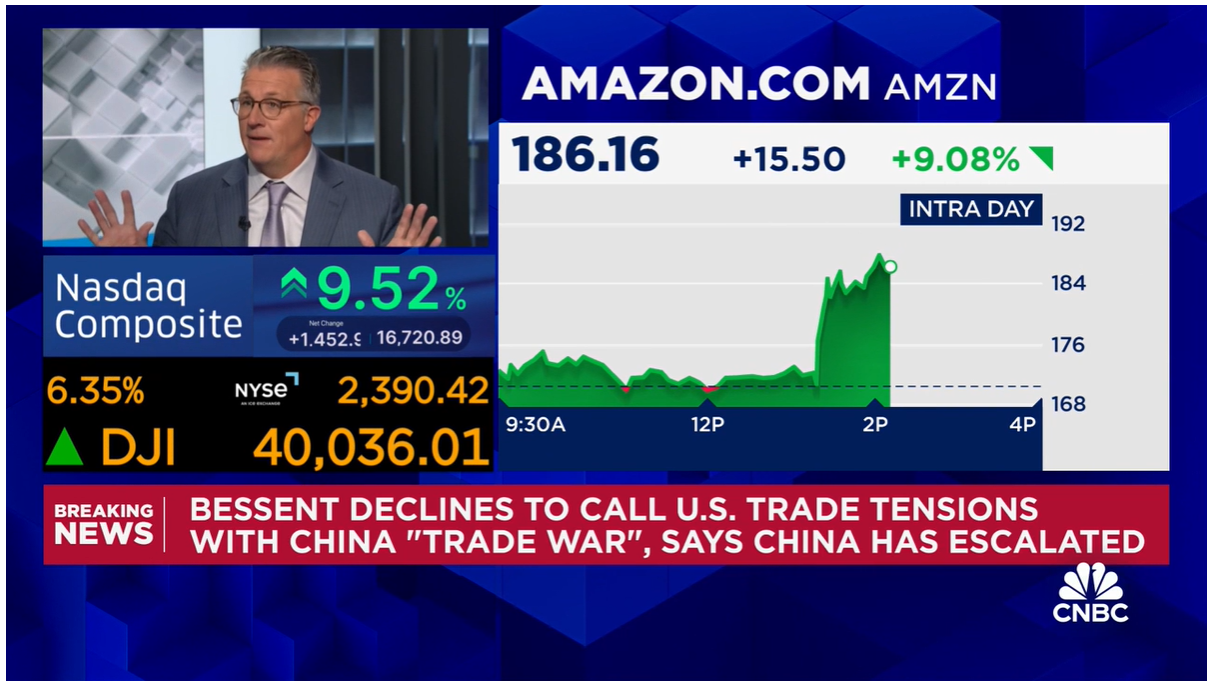


