
The Full Story:
I first visited Jekyll Island, Georgia in the mid-90’s, just after the internet went public. For those not familiar with Jekyll Island, it became the south’s Newport, RI for the robber barons of the Gilded Age. Imagine the evening cocktail banter between the Morgans, Rockefellers, Pritzkers, Vanderbilts, et al. in the clubhouse dining hall. One such discussion in 1910 led to the founding of the U.S. Federal Reserve. Another in 1915 led to the first transcontinental telephone call between Theodore Vail, Alexander Graham Bell, and President Woodrow Wilson.
Of all the amazing Jekyll Island stories I heard over the years though, nothing struck me more than the heated debate over electrifying the island in 1903. Apparently, some of the most wealthy and industrious people on the planet argued that electricity might just be a fad! I was floored at how short-sighted even titans can be. On my flight back to San Francisco after that first visit, I found myself reflecting on these stories and thinking, “There may be something to this ‘internet.’”
What Grows an Economy
Economic growth sprouts from two primary inputs, growth in the number of laborers (workforce) and the growth in output per laborer (productivity). Every so often, major political, societal, or technological breakthroughs propel one or both variables higher, stimulating economic growth rates and quality-of-life measures.
Electricity provided the ability for workers to work longer hours (productivity). Inclusion of women into the labor force provided more laborers (workforce). The construction of highways and railroads improved the division of labor (productivity). The discovery of penicillin increased life expectancy by eight years (workforce).
On that same flight from Jekyll Island, I pondered how to measure the benefits of internet adoption through this lens. Clearly, the internet itself wouldn’t create workers, but enhanced information access should increase productivity and profitability. Here’s what happened:

Note that on average, labor productivity typically runs between 1-2%. However, during the internet age, productivity grew at twice that rate, validating the productivity theory. As for the profitability theory?

This chart chronicles pre-tax corporate profits between 1990 and 2008. Like productivity, profit growth rates doubled during the period of widespread internet adoption: Theory proven.
The next economic “big bang” that captured my attention was globalization and the integration of the BRICs economies (Brazil, Russia, India, and China). The BRICs house nearly half of the world’s population, and therefore, half of the planet’s potential labor force. Integrating the underutilized BRICs’ labor force into the modern global economy should have theoretically reduced global poverty rates and reduced global inflationary levels.

According to World Bank, the global poverty rate has fallen by 50% over the past dozen years. Over that same time-period, consumer inflation levels worldwide also fell by half:

Theory proven.
Since the Great Financial Crisis ended, there really haven’t been any breakthroughs to enhance productivity or labor force. The advances we have made, including higher levels of social spending, more realistic video games, and evermore addictive social media platforms, have had no effect on either. In fact, by 2016, economists began discussing “secular stagnation”, the idea that high government indebtedness, low workforce growth, and low productivity growth would plague the U.S. economy with low GDP growth for decades. That sounds dire and unacceptable… cue the AI revolution!
Imagine an optimized economy. An economy that works smarter, faster, and more accurately all the time. Think about the mundane tasks you do daily that, if automated, would free you to do higher-level tasks. For instance, if I let Chat GPT write our blogs, I would regain my Fridays and thus 20% of my workweek! That won’t happen, as writing these missives sharpens our minds as investment managers and your returns as our investors. However, AI does give me the CHOICE. That’s what will become so liberating. Consider this analysis of skill requirements within the AI age:

Notice that the machines will do machine things like software coding, while the humans will do human things like strategizing, communicating, and collaborating.
Imagine the time it will save Perry Green, our CFO, if he could tell the machine to build our 2025 budget using a simple set of assumptions rather than contemplate and key every cell. It would add countless hours back each December which Perry can reinvest in client consultations and financial plan construction.
This time top-grading would happen firm-wide as we task less, and strategize and communicate more. Client outcomes will improve. Job satisfaction will improve. Profitability will improve. Win, win, win!
At its fullest expression, AI adoption not only increases productivity, but it also increases the size of our available labor force. Goldman Sachs predicted, in a controversial study, that 25% of observable jobs would soon be automated:

While that sounds frightening, recall that our economy suffers from a labor shortage, not an employment shortage. In fact, we currently have 1.4 job openings for every unemployed American:

If AI “workers” could slot in and take those jobs, we would capture even more economics and even more profits.
This will happen. The impact of AI will show up as productivity gains in the data, but the concept of minting “virtual” workers adds further economic lift. Integrating AI with dexterous robotics will unleash perhaps the greatest technological upgrade cycle in the history of the world.
Welcome to the next gilded age.
-David

Sources: Bureau of Labor Statistics, FRED, Poverty and Inequality Platform, Mahler, IBM, Barclays, Goldman Sachs, LSEG Datastream, Yardeni, Kendrick, Syverson
This communication and its contents are for informational and educational purposes only and should not be used as the sole basis for any investment decision. The information contained herein is based on publicly available sources believed to be reliable but is not a representation, expressed or implied, as to the accuracy, completeness, or correctness of said information. Past performance does not guarantee future results.
">Appraising AI The Full Story:I first visited Jekyll Island, Georgia in the mid-90’s, just after the internet went public. For those not familiar with Jekyll Island, it became the south’s Newport, RI for the robber barons of the Gilded Age. Imagine the evening cocktail banter between the Morgans, Rockefellers, Pritzkers, Vanderbilts, et al. in the clubhouse dining hall. One such discussion in 1910 led to the founding of the U.S. Federal Reserve. Another in 1915 led to the first transcontinental telephone call between Theodore Vail, Alexander Graham Bell, and President Woodrow Wilson.
Of all the amazing Jekyll Island stories I heard over the years though, nothing struck me more than the heated debate over electrifying the island in 1903. Apparently, some of the most wealthy and industrious people on the planet argued that electricity might just be a fad! I was floored at how short-sighted even titans can be. On my flight back to San Francisco after that first visit, I found myself reflecting on these stories and thinking, “There may be something to this ‘internet.’”
What Grows an Economy
Economic growth sprouts from two primary inputs, growth in the number of laborers (workforce) and the growth in output per laborer (productivity). Every so often, major political, societal, or technological breakthroughs propel one or both variables higher, stimulating economic growth rates and quality-of-life measures.
Electricity provided the ability for workers to work longer hours (productivity). Inclusion of women into the labor force provided more laborers (workforce). The construction of highways and railroads improved the division of labor (productivity). The discovery of penicillin increased life expectancy by eight years (workforce).
On that same flight from Jekyll Island, I pondered how to measure the benefits of internet adoption through this lens. Clearly, the internet itself wouldn’t create workers, but enhanced information access should increase productivity and profitability. Here’s what happened:
Note that on average, labor productivity typically runs between 1-2%. However, during the internet age, productivity grew at twice that rate, validating the productivity theory. As for the profitability theory?
This chart chronicles pre-tax corporate profits between 1990 and 2008. Like productivity, profit growth rates doubled during the period of widespread internet adoption: Theory proven.
The next economic “big bang” that captured my attention was globalization and the integration of the BRICs economies (Brazil, Russia, India, and China). The BRICs house nearly half of the world’s population, and therefore, half of the planet’s potential labor force. Integrating the underutilized BRICs’ labor force into the modern global economy should have theoretically reduced global poverty rates and reduced global inflationary levels.
According to World Bank, the global poverty rate has fallen by 50% over the past dozen years. Over that same time-period, consumer inflation levels worldwide also fell by half:
Theory proven.
Since the Great Financial Crisis ended, there really haven’t been any breakthroughs to enhance productivity or labor force. The advances we have made, including higher levels of social spending, more realistic video games, and evermore addictive social media platforms, have had no effect on either. In fact, by 2016, economists began discussing “secular stagnation”, the idea that high government indebtedness, low workforce growth, and low productivity growth would plague the U.S. economy with low GDP growth for decades. That sounds dire and unacceptable… cue the AI revolution!
Imagine an optimized economy. An economy that works smarter, faster, and more accurately all the time. Think about the mundane tasks you do daily that, if automated, would free you to do higher-level tasks. For instance, if I let Chat GPT write our blogs, I would regain my Fridays and thus 20% of my workweek! That won’t happen, as writing these missives sharpens our minds as investment managers and your returns as our investors. However, AI does give me the CHOICE. That’s what will become so liberating. Consider this analysis of skill requirements within the AI age:
Notice that the machines will do machine things like software coding, while the humans will do human things like strategizing, communicating, and collaborating.
Imagine the time it will save Perry Green, our CFO, if he could tell the machine to build our 2025 budget using a simple set of assumptions rather than contemplate and key every cell. It would add countless hours back each December which Perry can reinvest in client consultations and financial plan construction.
This time top-grading would happen firm-wide as we task less, and strategize and communicate more. Client outcomes will improve. Job satisfaction will improve. Profitability will improve. Win, win, win!
At its fullest expression, AI adoption not only increases productivity, but it also increases the size of our available labor force. Goldman Sachs predicted, in a controversial study, that 25% of observable jobs would soon be automated:
While that sounds frightening, recall that our economy suffers from a labor shortage, not an employment shortage. In fact, we currently have 1.4 job openings for every unemployed American:
If AI “workers” could slot in and take those jobs, we would capture even more economics and even more profits.
This will happen. The impact of AI will show up as productivity gains in the data, but the concept of minting “virtual” workers adds further economic lift. Integrating AI with dexterous robotics will unleash perhaps the greatest technological upgrade cycle in the history of the world.
Welcome to the next gilded age.
-David
Sources: Bureau of Labor Statistics, FRED, Poverty and Inequality Platform, Mahler, IBM, Barclays, Goldman Sachs, LSEG Datastream, Yardeni, Kendrick, Syverson
This communication and its contents are for informational and educational purposes only and should not be used as the sole basis for any investment decision. The information contained herein is based on publicly available sources believed to be reliable but is not a representation, expressed or implied, as to the accuracy, completeness, or correctness of said information. Past performance does not guarantee future results.
" class="link-chevron">
The Full Story:
On Wednesday, the Federal Reserve chose to leave rates unchanged for the fourth consecutive meeting. Market participants (i.e., algorithms) scrutinized every word in Powell’s prepared remarks and within his Q&A. Stocks initially reacted positively to the Chairman’s remarks, only to fall sharply after the following comment:
“Based on the meeting today, I would tell you that I don’t think it’s likely that the Committee will reach a level of confidence by the time of the March meeting to identify March as the time to do that. But that’s to be seen. So, I wouldn’t call — you know, when you ask me about in the near term, I’m hearing that as March. I would say that’s probably not the most likely case or what we would call the base case.”
Those who own stocks based on timing and number of rate cuts took this news hard and sold. We did not. By zooming out, one gets a fuller and more supportive picture of the Fed’s thinking. First, the Fed acknowledges that inflation has fallen decisively and appears headed toward its 2% target. Second, strength within the US economy and labor market has not disrupted inflation’s path lower. Third, the Fed seems unconcerned about a reacceleration in inflation, only that inflation may plateau at a level higher than 2%. For this reason, they want to remain observant a little while longer before cutting. However, they do recognize that by annualizing shorter time frame data, inflation appears well within their target range. Note the 3-month annualization of different inflation measures presented below:

Each of these measures falls within range! To reign in rate-cut enthusiasts, Powell redirected attention to the trailing twelve-month figures, which provide more datapoints and, therefore, more confidence material:

By lengthening the data set, inflation pops back out of range, but any way you slice it, inflation is trending lower.
Whether the Fed cuts in March or waits until May is academic. The Fed has projected .75% of cuts this year, and that number may rise further when they release updated forecasts on March 20th. There is no present reason for the Fed to hold the overnight rate at 5.5% with inflation floating below 3%, but the strength in the economy provides Powell more time to digest more data, to gain more confidence, that cuts are appropriate…and recent economic data has surprised to the upside:

So, the Fed has time. Most importantly, Powell went into this inflation fighting cycle believing that they would have to choke off economic demand to whip inflation (i.e., cause a recession). Now, Powell believes that the economy can self-regulate and simply increase supply to meet demand. Therefore, we can have economic growth and rate cuts. That’s the mother’s milk for corporate earnings. And that’s why markets rallied back sharply to end the week!
The News: Earnings
Earnings season has hit full stride. To date, 220 of the S&P 500 companies have reported their fourth-quarter earnings, with 68% of those reporting beating estimates. The chart below breaks down sector contributions:

Of the eleven sectors within the S&P 500, seven have produced positive fourth-quarter earnings results. However, the bulk of the contribution stems from large cap technology names housed within the tech, communication, and consumer discretionary sectors. While the Magnificent 7 may get overhyped, it’s not without good reason based on their earnings results:

The earnings power of Apple, Amazon, Google, Meta, Microsoft, Nvidia, and Tesla are mind-blowing and have eclipsed earnings weakness among the remaining 493 over the past few quarters. However, as the year progresses, analysts expect earnings acceleration beyond the biggies, which will help broaden participation and improve overall investor outcomes.
Don’t let the Fed’s rate noise distract you. Broadening corporate earnings contribution is the news…and the news is good!
Have a great weekend!
-David
Sources: Bureau of Economic Analysis, FRED, LSEG Datastream I/B/E/S, Yardeni Research
This communication and its contents are for informational and educational purposes only and should not be used as the sole basis for any investment decision. The information contained herein is based on publicly available sources believed to be reliable but is not a representation, expressed or implied, as to the accuracy, completeness, or correctness of said information. Past performance does not guarantee future results.
">The Noise: The Fed The Full Story:On Wednesday, the Federal Reserve chose to leave rates unchanged for the fourth consecutive meeting. Market participants (i.e., algorithms) scrutinized every word in Powell’s prepared remarks and within his Q&A. Stocks initially reacted positively to the Chairman’s remarks, only to fall sharply after the following comment:
“Based on the meeting today, I would tell you that I don’t think it’s likely that the Committee will reach a level of confidence by the time of the March meeting to identify March as the time to do that. But that’s to be seen. So, I wouldn’t call — you know, when you ask me about in the near term, I’m hearing that as March. I would say that’s probably not the most likely case or what we would call the base case.”
Those who own stocks based on timing and number of rate cuts took this news hard and sold. We did not. By zooming out, one gets a fuller and more supportive picture of the Fed’s thinking. First, the Fed acknowledges that inflation has fallen decisively and appears headed toward its 2% target. Second, strength within the US economy and labor market has not disrupted inflation’s path lower. Third, the Fed seems unconcerned about a reacceleration in inflation, only that inflation may plateau at a level higher than 2%. For this reason, they want to remain observant a little while longer before cutting. However, they do recognize that by annualizing shorter time frame data, inflation appears well within their target range. Note the 3-month annualization of different inflation measures presented below:
Each of these measures falls within range! To reign in rate-cut enthusiasts, Powell redirected attention to the trailing twelve-month figures, which provide more datapoints and, therefore, more confidence material:
By lengthening the data set, inflation pops back out of range, but any way you slice it, inflation is trending lower.
Whether the Fed cuts in March or waits until May is academic. The Fed has projected .75% of cuts this year, and that number may rise further when they release updated forecasts on March 20th. There is no present reason for the Fed to hold the overnight rate at 5.5% with inflation floating below 3%, but the strength in the economy provides Powell more time to digest more data, to gain more confidence, that cuts are appropriate…and recent economic data has surprised to the upside:
So, the Fed has time. Most importantly, Powell went into this inflation fighting cycle believing that they would have to choke off economic demand to whip inflation (i.e., cause a recession). Now, Powell believes that the economy can self-regulate and simply increase supply to meet demand. Therefore, we can have economic growth and rate cuts. That’s the mother’s milk for corporate earnings. And that’s why markets rallied back sharply to end the week!
The News: Earnings
Earnings season has hit full stride. To date, 220 of the S&P 500 companies have reported their fourth-quarter earnings, with 68% of those reporting beating estimates. The chart below breaks down sector contributions:
Of the eleven sectors within the S&P 500, seven have produced positive fourth-quarter earnings results. However, the bulk of the contribution stems from large cap technology names housed within the tech, communication, and consumer discretionary sectors. While the Magnificent 7 may get overhyped, it’s not without good reason based on their earnings results:
The earnings power of Apple, Amazon, Google, Meta, Microsoft, Nvidia, and Tesla are mind-blowing and have eclipsed earnings weakness among the remaining 493 over the past few quarters. However, as the year progresses, analysts expect earnings acceleration beyond the biggies, which will help broaden participation and improve overall investor outcomes.
Don’t let the Fed’s rate noise distract you. Broadening corporate earnings contribution is the news…and the news is good!
Have a great weekend!
-David
Sources: Bureau of Economic Analysis, FRED, LSEG Datastream I/B/E/S, Yardeni Research
This communication and its contents are for informational and educational purposes only and should not be used as the sole basis for any investment decision. The information contained herein is based on publicly available sources believed to be reliable but is not a representation, expressed or implied, as to the accuracy, completeness, or correctness of said information. Past performance does not guarantee future results.
" class="link-chevron">
The Full Story

This time last year, pessimism reigned. Wall Street strategists were nearly unanimous in their prediction that 2023 would provide businesses with a recession and investors with losses. As we noted this time last year, sour sentiment cleared the way for gains, as the market prefers to behave as least expected. In fact, the S&P 500 did not end 2023 with losses, but rather with 20%+ gains. Not only did this wildly surprise the Negative Neds and Nancys last year, also note that in the chart above that Wall Street analysts haven’t projected a year of 20%+ gains in any of the last 25. In fact, most of the yearly go-forward projections resided between 5-10%, an increment rarely reached:

Between 1950 and 2023, the S&P 500 delivered “average” gains about 5% of the time, even though the “smart money” projects “average” gains around 75% of the time. As strategists ourselves, we can sympathize. If economic actors would simply act rationally, per the economic textbooks, volatility would subside and math would prevail. After all, forecasting year-end targets for the S&P 500 only requires projecting market-wide P/E ratios and aggregate earnings numbers.
In an environment of 5% corporate bond yields, the stock market P/E should approximate 20x. In a 2% GDP environment with 2.5% Inflation, earnings growth should fall somewhere between 4% and 10%, depending upon profit margin variance. Given that the S&P 500 finished 2023 with a P/E approximating 20, we have reached that target and only have to solve for earnings. Strategists currently project full-year S&P 500 earnings roughly 5% above last year’s total, translating into a 5% gain for 2024. Strategists then add premium and discounting factors to derive ultimate targets. Here are Wall Street’s predictions for 2024:

On average, the Wall Street strategists above expect the S&P 500 to end 2024 at 4,861 for a gain of only 2%. Removing the influence of outliers, the median gain projected is still only 2.2%. By interpretation, the Wall Street consensus expects the economy to flatline in 2024, profit margins to stagnate, and corporate earnings to languish. Those are very low expectations, and that’s very good news!
On Friday, January 26th, the S&P 500 closed at 4890, above the average year-end targets for Wall Street strategists. This week, we learned that the chronically underestimated US economy grew 3.3% in the 4th quarter vs. estimates of 2% growth.

For the full year, the US economy grew at a 2.5% pace, despite substantial monetary restraint from the Fed, and well ahead of consensus. Additionally, inflation data contained within the GDP report landed right on the Fed’s target of 2%, clearing the path for rate cuts. Markets, in turn, rallied to fresh all-time highs. More economic growth than expected suggests more earnings than expected, and less inflation than expected suggests lower rates than expected. So far, 2024 looks a lot like 2023: Low expectations, rosy reality!
What should you expect when Wall Street expects a bear?
It’s a bull!
Have a great week!
-David
Sources: Bloomberg, Carson Research, Financial Times, US Department of Commerce, Wells Fargo Economics
This communication and its contents are for informational and educational purposes only and should not be used as the sole basis for any investment decision. The information contained herein is based on publicly available sources believed to be reliable but is not a representation, expressed or implied, as to the accuracy, completeness, or correctness of said information. Past performance does not guarantee future results.
">What to Expect When Wall Street is Expecting The Full Story
This time last year, pessimism reigned. Wall Street strategists were nearly unanimous in their prediction that 2023 would provide businesses with a recession and investors with losses. As we noted this time last year, sour sentiment cleared the way for gains, as the market prefers to behave as least expected. In fact, the S&P 500 did not end 2023 with losses, but rather with 20%+ gains. Not only did this wildly surprise the Negative Neds and Nancys last year, also note that in the chart above that Wall Street analysts haven’t projected a year of 20%+ gains in any of the last 25. In fact, most of the yearly go-forward projections resided between 5-10%, an increment rarely reached:
Between 1950 and 2023, the S&P 500 delivered “average” gains about 5% of the time, even though the “smart money” projects “average” gains around 75% of the time. As strategists ourselves, we can sympathize. If economic actors would simply act rationally, per the economic textbooks, volatility would subside and math would prevail. After all, forecasting year-end targets for the S&P 500 only requires projecting market-wide P/E ratios and aggregate earnings numbers.
In an environment of 5% corporate bond yields, the stock market P/E should approximate 20x. In a 2% GDP environment with 2.5% Inflation, earnings growth should fall somewhere between 4% and 10%, depending upon profit margin variance. Given that the S&P 500 finished 2023 with a P/E approximating 20, we have reached that target and only have to solve for earnings. Strategists currently project full-year S&P 500 earnings roughly 5% above last year’s total, translating into a 5% gain for 2024. Strategists then add premium and discounting factors to derive ultimate targets. Here are Wall Street’s predictions for 2024:
On average, the Wall Street strategists above expect the S&P 500 to end 2024 at 4,861 for a gain of only 2%. Removing the influence of outliers, the median gain projected is still only 2.2%. By interpretation, the Wall Street consensus expects the economy to flatline in 2024, profit margins to stagnate, and corporate earnings to languish. Those are very low expectations, and that’s very good news!
On Friday, January 26th, the S&P 500 closed at 4890, above the average year-end targets for Wall Street strategists. This week, we learned that the chronically underestimated US economy grew 3.3% in the 4th quarter vs. estimates of 2% growth.
For the full year, the US economy grew at a 2.5% pace, despite substantial monetary restraint from the Fed, and well ahead of consensus. Additionally, inflation data contained within the GDP report landed right on the Fed’s target of 2%, clearing the path for rate cuts. Markets, in turn, rallied to fresh all-time highs. More economic growth than expected suggests more earnings than expected, and less inflation than expected suggests lower rates than expected. So far, 2024 looks a lot like 2023: Low expectations, rosy reality!
What should you expect when Wall Street expects a bear?
It’s a bull!
Have a great week!
-David
Sources: Bloomberg, Carson Research, Financial Times, US Department of Commerce, Wells Fargo Economics
This communication and its contents are for informational and educational purposes only and should not be used as the sole basis for any investment decision. The information contained herein is based on publicly available sources believed to be reliable but is not a representation, expressed or implied, as to the accuracy, completeness, or correctness of said information. Past performance does not guarantee future results.
" class="link-chevron">
sentiment doesn’t change on its own. Sentiment changes require catalysts. For 2023, our belief that the expected relationship between inflation and unemployment would invert and provide a steady stream of positive surprises became our #1 thing. Economic surprises would drive sentiment surprises, which would drive investor surprises. Needless to say, our forecast placed us among the anxious minority.
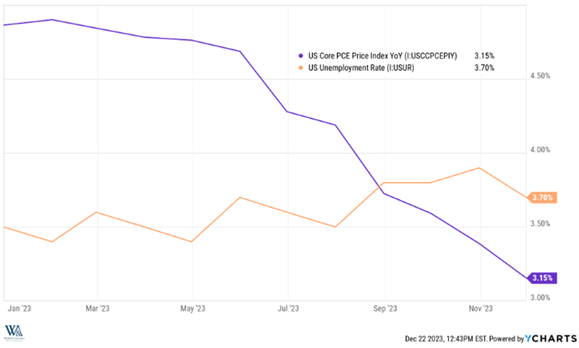
Classic economics textbooks teach us that disinflation and tight labor markets cannot coexist. In 2023, they did. As this chart shows, the Fed’s preferred inflation measure, the core PCE, dropped from 5% to 3% (purple line) over the year while the US unemployment rate remained unchanged (orange line):
According to economic orthodoxy, this chart shouldn’t exist. An economy at or near “full employment” with more job openings than jobs available should experience wage inflation that metastasizes into overall price inflation. Econ nerds will recognize this as the Phillips Curve theory which states that inflation and unemployment have a stable and inverse relationship. Apparently not, says 2023. But why? We believed that the most anticipated recession of all time would compel companies to restructure and reduce bloated bureaucratic structures rather than fire hard to find frontline workers, more typical of the kneejerk recessionary response that drives unemployment rates higher. Furthermore, transformational technology investments relieve payroll demands and increase profit margins, placing less pressure on price escalations to power profits. In short, companies used the threat of recession to perform the surgery required to streamline businesses and enhance operating margins, rather than rely on layoffs. Note the change in profit margins despite the disinflation:
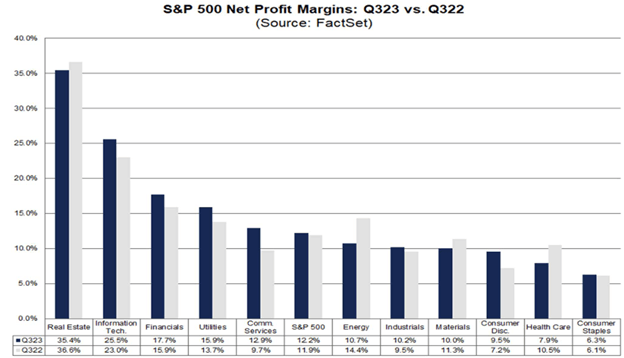
Overall, S&P 500 companies increased profit margins from 11.9% to 12.2%, with 55% of companies showing gains. This happened despite record unemployment levels, surging interest rates, and fading stimulus support. While earnings didn’t grow much in 2023, operating structures right-sized, corporations managed to disinflate pricing, and front-line employees maintained their employment. In the 1970’s, corporate managements used inflation as cover to chest thump over revenue gains and justify bloated operating structures. Economists called this perversion the “money illusion.” In the 2020s, corporate management recognized that unabated inflation would bait the Fed into triggering a recession. As such they did the hard things to fortify their businesses and enhance margins. Should 2024 deliver the long-anticipated recession, they stand ready. Should it not, they stand primed:
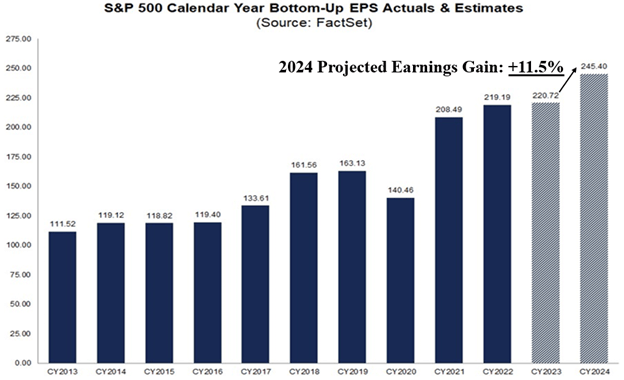
Today, analysts expect S&P 500 earnings will rise 11.5% next year. The Federal Reserve expects inflation to exit the year at 2.4%, and economists anticipate six interest rate cuts. Any of those alone would stoke investor enthusiasm. The prospect of all three explains this rapid and resolute rally into year-end. What 2024 will hold depends on correctly identifying the #1 thing again and positioning accordingly. But for that reveal, you will have to register for our 2024 Outlook! Stay tuned…
Enjoy the holiday season with your families, and thank you sincerely for being part of ours.
David S. Waddell
CEO, Chief Investment Strategist
Source: FactSet, YCharts, Federal Reserve
This communication and its contents are for informational and educational purposes only and should not be used as the sole basis for any investment decision. The information contained herein is based on publicly available sources believed to be reliable but is not a representation, expressed or implied, as to the accuracy, completeness, or correctness of said information. Past performance does not guarantee future results.
">The #1 Thing
sentiment doesn’t change on its own. Sentiment changes require catalysts. For 2023, our belief that the expected relationship between inflation and unemployment would invert and provide a steady stream of positive surprises became our #1 thing. Economic surprises would drive sentiment surprises, which would drive investor surprises. Needless to say, our forecast placed us among the anxious minority.
Classic economics textbooks teach us that disinflation and tight labor markets cannot coexist. In 2023, they did. As this chart shows, the Fed’s preferred inflation measure, the core PCE, dropped from 5% to 3% (purple line) over the year while the US unemployment rate remained unchanged (orange line):
According to economic orthodoxy, this chart shouldn’t exist. An economy at or near “full employment” with more job openings than jobs available should experience wage inflation that metastasizes into overall price inflation. Econ nerds will recognize this as the Phillips Curve theory which states that inflation and unemployment have a stable and inverse relationship. Apparently not, says 2023. But why? We believed that the most anticipated recession of all time would compel companies to restructure and reduce bloated bureaucratic structures rather than fire hard to find frontline workers, more typical of the kneejerk recessionary response that drives unemployment rates higher. Furthermore, transformational technology investments relieve payroll demands and increase profit margins, placing less pressure on price escalations to power profits. In short, companies used the threat of recession to perform the surgery required to streamline businesses and enhance operating margins, rather than rely on layoffs. Note the change in profit margins despite the disinflation:
Overall, S&P 500 companies increased profit margins from 11.9% to 12.2%, with 55% of companies showing gains. This happened despite record unemployment levels, surging interest rates, and fading stimulus support. While earnings didn’t grow much in 2023, operating structures right-sized, corporations managed to disinflate pricing, and front-line employees maintained their employment. In the 1970’s, corporate managements used inflation as cover to chest thump over revenue gains and justify bloated operating structures. Economists called this perversion the “money illusion.” In the 2020s, corporate management recognized that unabated inflation would bait the Fed into triggering a recession. As such they did the hard things to fortify their businesses and enhance margins. Should 2024 deliver the long-anticipated recession, they stand ready. Should it not, they stand primed:
Today, analysts expect S&P 500 earnings will rise 11.5% next year. The Federal Reserve expects inflation to exit the year at 2.4%, and economists anticipate six interest rate cuts. Any of those alone would stoke investor enthusiasm. The prospect of all three explains this rapid and resolute rally into year-end. What 2024 will hold depends on correctly identifying the #1 thing again and positioning accordingly. But for that reveal, you will have to register for our 2024 Outlook! Stay tuned…
Enjoy the holiday season with your families, and thank you sincerely for being part of ours.
David S. Waddell
CEO, Chief Investment Strategist
Source: FactSet, YCharts, Federal Reserve
This communication and its contents are for informational and educational purposes only and should not be used as the sole basis for any investment decision. The information contained herein is based on publicly available sources believed to be reliable but is not a representation, expressed or implied, as to the accuracy, completeness, or correctness of said information. Past performance does not guarantee future results.
" class="link-chevron">
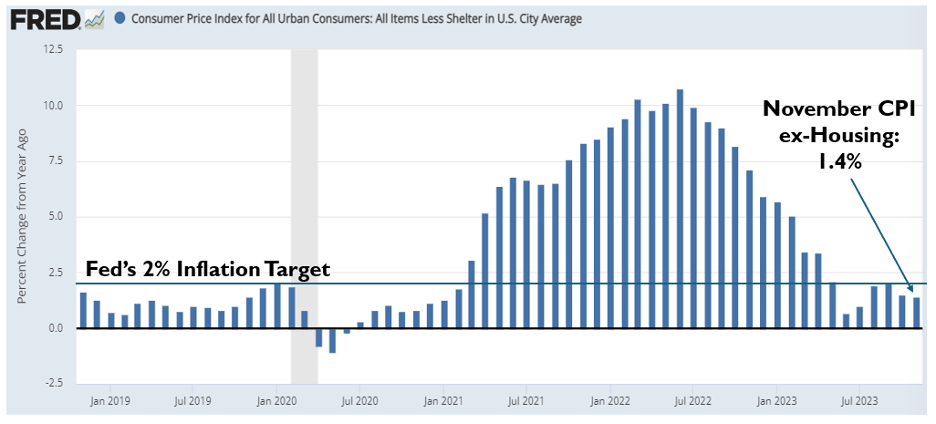
Currently, the Fed has rates set nearly 2.5% above the CPI inflation rate. Over the past 20 years, this level of policy restriction has preceded recession. Should CPI continue falling, this spread will only widen, increasing recession odds further. Many argue that inflation will soon reignite and that the Fed must remain vigilant to avoid repeating the largess policy mistakes of the 1960s. Are they right?
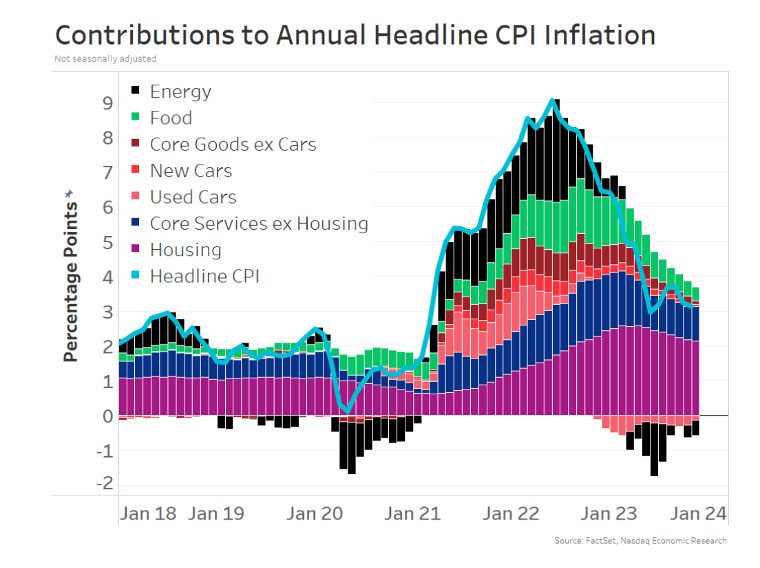
The chart above deconstructs CPI into broad categories and chronicles contribution. Note that when CPI clocked in at 9%, EVERYTHING was inflating. Today, most categories have flatlined, with energy and used cars actually deflating. Housing remains the only stubborn—and sizable—contributor. In fact, if we calculate CPI without housing inflation, the annual inflation rate falls comfortably below the Fed’s 2% target:
The Fed knows that its housing inflation measure operates with a lag. Comparing the CPI housing inflation rate with actual listed rental rates per Zillow reveals large and lagging disparities:
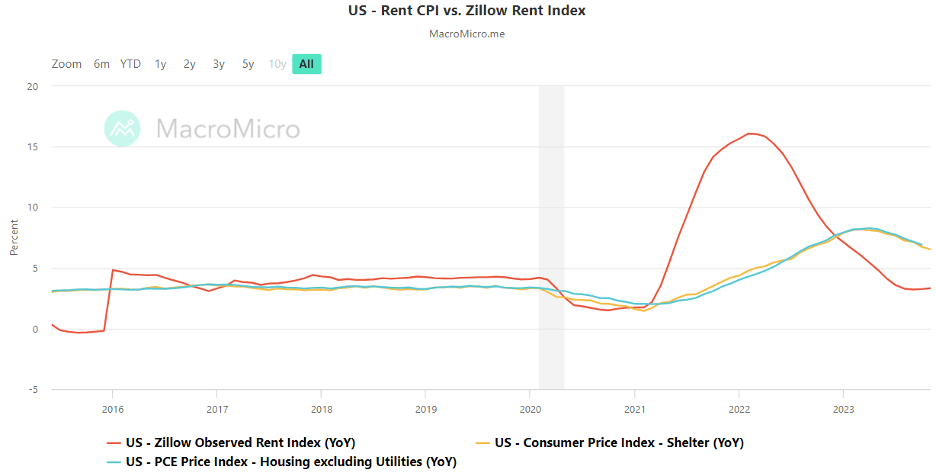
Specifically, the BLS reported a trailing twelve-month housing inflation rate of 6.53% in November. According to Zillow, observable rental rates have risen half as much at 3.32%. Historically, trend shifts in the Zillow price index front-run changes in the BLS price index by 6-12 months. Given the historical relationship, unless we see a strong increase in listed rental rates, the CPI Shelter inflation measure will continue falling, pulling overall inflation down with it.
The Fed lowered its inflation projections significantly in the FOMC’s Summary of Economic Projections released Wednesday (seen below), sparking a historic market melt-up of 1.5% for the S&P 500 and 4% for the small cap Russell 2000:
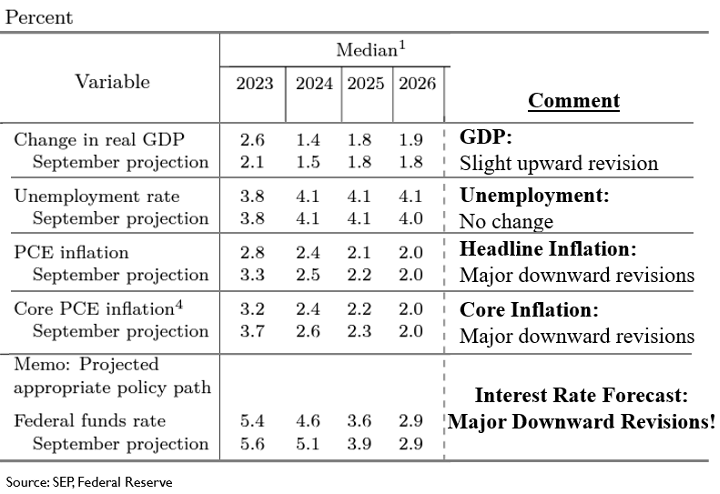
By the Fed’s own estimate, the Federal Funds Rate will end 2024 a full percentage point below the current policy rate. That equates to four 0.25% interest rate cuts next year. The futures market now sees even more, increasing projections from 6 to 8 cuts next year. In response, longer-term interest rates have collapsed, with the 10-year and 30-year Treasury yields back down to 4% after breaching 5% mid-October. In sum, things have changed significantly—for the better!
Rally Reach
Remember that falling interest rates lead to rising stock market multiples. Remember also that, as of the third quarter, corporate earnings have resumed their uptrend. The combination of rising P/Es and rising earnings has benefitted the entire stock market. This is a welcome departure from the very narrow gains held aloft by the Magnificent 7 for many years. Take stock of the percentage returns below, year-to-date (YTD) and month-to-date (MTD):
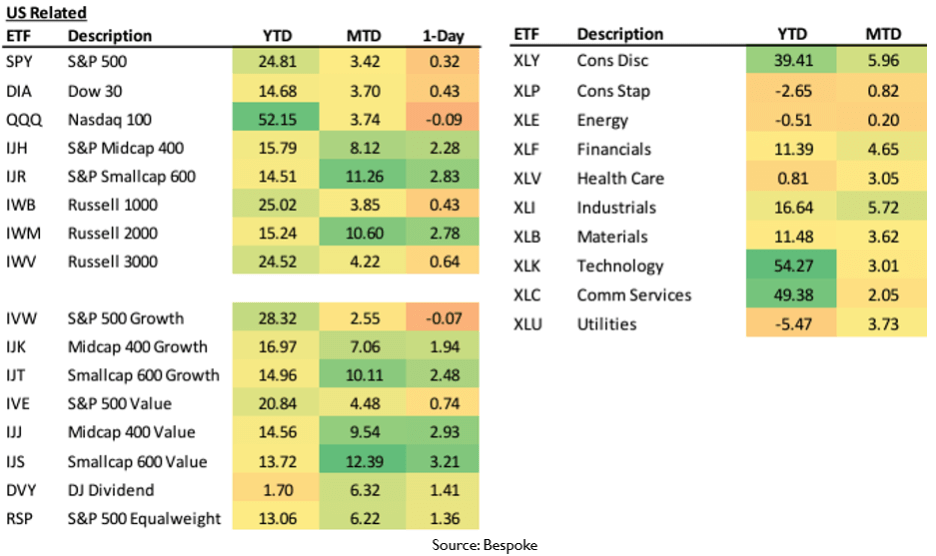
Note that, for the month of December, the NASDAQ 100 (Magnificent 7+) has gained 3.7% so far, while the small cap value index has gained 12.4%. Technology overall rose 3.0%, while financials rose 4.7%. It’s great when the bellwether S&P 500 gains, it’s even GREATER when everything else does. This rally has reach… and we suspect this “rally of the rest” will define 2024.
Have an excellent week,
David S. Waddell
CEO, Chief Investment Strategist
Source: FRED, FactSet, Nasdaq Economic Research, MacroMicro.Me, SEP, Federal Reserve, Bespoke
This communication and its contents are for informational and educational purposes only and should not be used as the sole basis for any investment decision. The information contained herein is based on publicly available sources believed to be reliable but is not a representation, expressed or implied, as to the accuracy, completeness, or correctness of said information. Past performance does not guarantee future results.
">The Everything Rally
Currently, the Fed has rates set nearly 2.5% above the CPI inflation rate. Over the past 20 years, this level of policy restriction has preceded recession. Should CPI continue falling, this spread will only widen, increasing recession odds further. Many argue that inflation will soon reignite and that the Fed must remain vigilant to avoid repeating the largess policy mistakes of the 1960s. Are they right?
The chart above deconstructs CPI into broad categories and chronicles contribution. Note that when CPI clocked in at 9%, EVERYTHING was inflating. Today, most categories have flatlined, with energy and used cars actually deflating. Housing remains the only stubborn—and sizable—contributor. In fact, if we calculate CPI without housing inflation, the annual inflation rate falls comfortably below the Fed’s 2% target:
The Fed knows that its housing inflation measure operates with a lag. Comparing the CPI housing inflation rate with actual listed rental rates per Zillow reveals large and lagging disparities:
Specifically, the BLS reported a trailing twelve-month housing inflation rate of 6.53% in November. According to Zillow, observable rental rates have risen half as much at 3.32%. Historically, trend shifts in the Zillow price index front-run changes in the BLS price index by 6-12 months. Given the historical relationship, unless we see a strong increase in listed rental rates, the CPI Shelter inflation measure will continue falling, pulling overall inflation down with it.
The Fed lowered its inflation projections significantly in the FOMC’s Summary of Economic Projections released Wednesday (seen below), sparking a historic market melt-up of 1.5% for the S&P 500 and 4% for the small cap Russell 2000:
By the Fed’s own estimate, the Federal Funds Rate will end 2024 a full percentage point below the current policy rate. That equates to four 0.25% interest rate cuts next year. The futures market now sees even more, increasing projections from 6 to 8 cuts next year. In response, longer-term interest rates have collapsed, with the 10-year and 30-year Treasury yields back down to 4% after breaching 5% mid-October. In sum, things have changed significantly—for the better!
Rally Reach
Remember that falling interest rates lead to rising stock market multiples. Remember also that, as of the third quarter, corporate earnings have resumed their uptrend. The combination of rising P/Es and rising earnings has benefitted the entire stock market. This is a welcome departure from the very narrow gains held aloft by the Magnificent 7 for many years. Take stock of the percentage returns below, year-to-date (YTD) and month-to-date (MTD):
Note that, for the month of December, the NASDAQ 100 (Magnificent 7+) has gained 3.7% so far, while the small cap value index has gained 12.4%. Technology overall rose 3.0%, while financials rose 4.7%. It’s great when the bellwether S&P 500 gains, it’s even GREATER when everything else does. This rally has reach… and we suspect this “rally of the rest” will define 2024.
Have an excellent week,
David S. Waddell
CEO, Chief Investment Strategist
Source: FRED, FactSet, Nasdaq Economic Research, MacroMicro.Me, SEP, Federal Reserve, Bespoke
This communication and its contents are for informational and educational purposes only and should not be used as the sole basis for any investment decision. The information contained herein is based on publicly available sources believed to be reliable but is not a representation, expressed or implied, as to the accuracy, completeness, or correctness of said information. Past performance does not guarantee future results.
" class="link-chevron">
Clearly, policy moves lag inflation moves. Most recently, inflation hit nearly 9% before the Fed’s policy response began. Since then, inflation has reversed, but Fed policy has not. Should it? Maybe. Let’s simplify this chart by subtracting the Fed’s effective policy rate from the inflation rate:
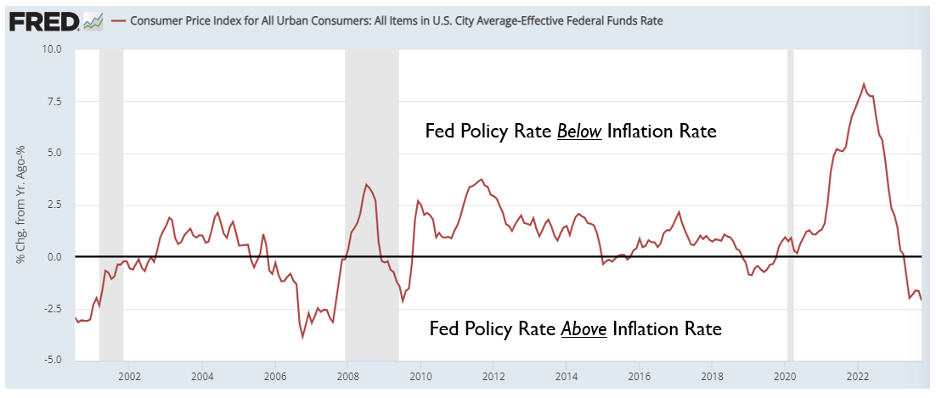
The Fed has set the current policy rate at 5.5%. The most current consumer price index inflation rate reads 3.2%, placing the policy rate nearly 2.5% above the inflation rate. Per Powell’s most recent commentaries, he views the current policy rate as “sufficiently restrictive”.
Indeed, over the past 20+ years, policy “restriction” at these levels preceded recessions. Should these restrictions prove too onerous, the Fed risks violating its second congressional mandate—maintaining full employment.
On Friday, we received the November Jobs report. Employers added 199,000 new workers vs. the 190,000 expected, and the US unemployment rate dropped from 3.9% to 3.7%. Additionally, wages grew 4% over the past twelve months.
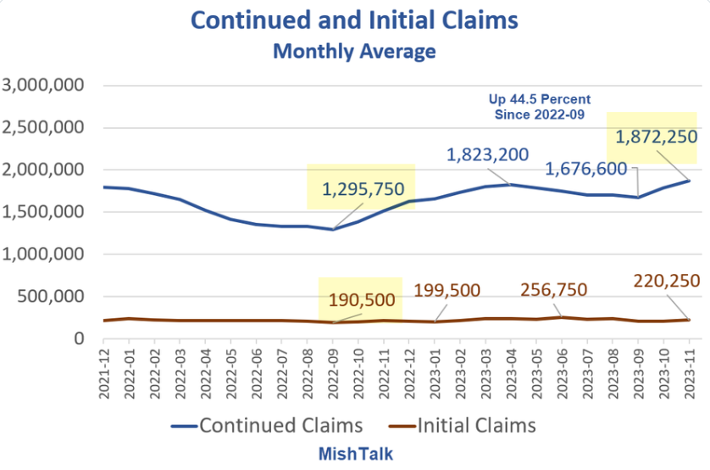
Payroll growth, wage growth and unemployment levels below 4% depict a labor market well within the “full employment” zone. However, by other measures, the labor market appears less full. While weekly initial jobless claims (layoffs) remain minimal, continuing claims (accumulated layoffs without new jobs attained) have risen recently:
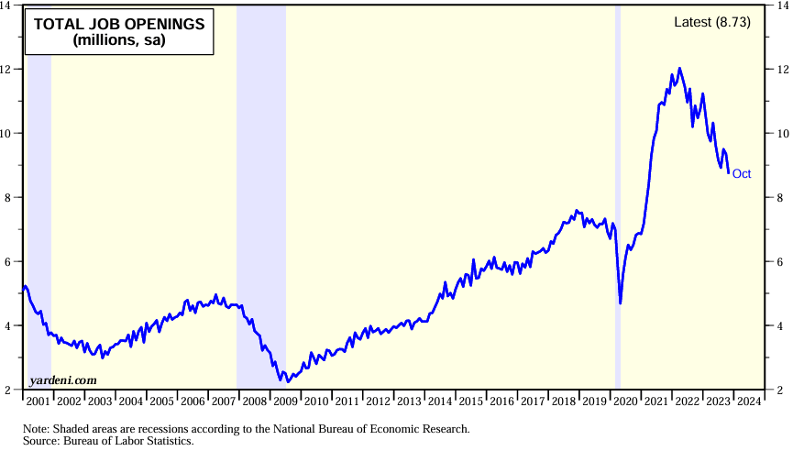
Additionally, according to the Job Openings and Labor Turnover Survey from earlier in the week, the number of job opening has fallen significantly recently:
Also, while the economy added 199,000 jobs in November, over 50,000 were returning UAW and SAG strikers. Additionally, government and healthcare accounted for 150,000. Private sector employers appear less confident. For instance, while leisure and hospitality added 40,000 jobs, consumer-facing retailers eliminated 40,000 jobs.
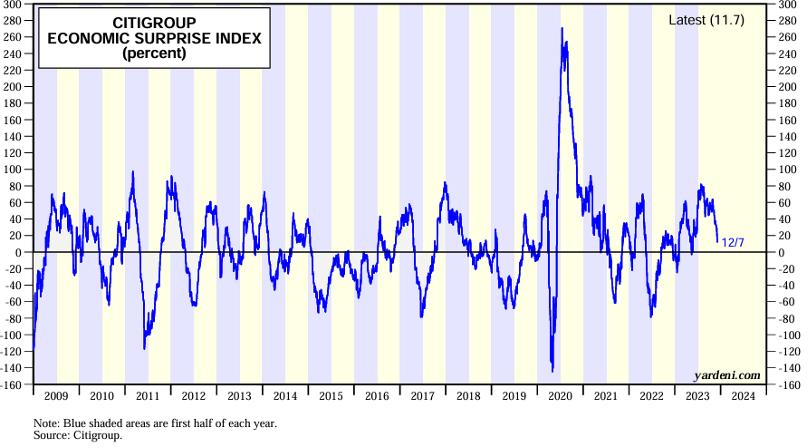
Outside of sectors subsidized by the government, job creation has stalled. Economic growth for the quarter has also downshifted significantly. The Fed’s “GDPnow” tool predicts 1.2% growth for the fourth quarter and the Citigroup Economic Surprise Index nears zero:
These labor softening developments warrant attention and public recognition from the Fed.
While 2023 consisted of higher-than-average inflation readings and reactionary rate hikes from the Fed to fulfill its “price stability” mandate, 2024 may consist of lower-than-average employment readings and reactionary rate cuts from the Fed to fulfill their “full employment” mandate. The game has changed.
Enjoy your weekend!
David S. Waddell
CEO, Chief Investment Strategist
Source: FRED, MishTalk, Bureau of Labor Statistics, Citigroup
This communication and its contents are for informational and educational purposes only and should not be used as the sole basis for any investment decision. The information contained herein is based on publicly available sources believed to be reliable but is not a representation, expressed or implied, as to the accuracy, completeness, or correctness of said information. Past performance does not guarantee future results.
">Migrating to Mandate #2
Clearly, policy moves lag inflation moves. Most recently, inflation hit nearly 9% before the Fed’s policy response began. Since then, inflation has reversed, but Fed policy has not. Should it? Maybe. Let’s simplify this chart by subtracting the Fed’s effective policy rate from the inflation rate:
The Fed has set the current policy rate at 5.5%. The most current consumer price index inflation rate reads 3.2%, placing the policy rate nearly 2.5% above the inflation rate. Per Powell’s most recent commentaries, he views the current policy rate as “sufficiently restrictive”.
Indeed, over the past 20+ years, policy “restriction” at these levels preceded recessions. Should these restrictions prove too onerous, the Fed risks violating its second congressional mandate—maintaining full employment.
On Friday, we received the November Jobs report. Employers added 199,000 new workers vs. the 190,000 expected, and the US unemployment rate dropped from 3.9% to 3.7%. Additionally, wages grew 4% over the past twelve months.
Payroll growth, wage growth and unemployment levels below 4% depict a labor market well within the “full employment” zone. However, by other measures, the labor market appears less full. While weekly initial jobless claims (layoffs) remain minimal, continuing claims (accumulated layoffs without new jobs attained) have risen recently:
Additionally, according to the Job Openings and Labor Turnover Survey from earlier in the week, the number of job opening has fallen significantly recently:
Also, while the economy added 199,000 jobs in November, over 50,000 were returning UAW and SAG strikers. Additionally, government and healthcare accounted for 150,000. Private sector employers appear less confident. For instance, while leisure and hospitality added 40,000 jobs, consumer-facing retailers eliminated 40,000 jobs.
Outside of sectors subsidized by the government, job creation has stalled. Economic growth for the quarter has also downshifted significantly. The Fed’s “GDPnow” tool predicts 1.2% growth for the fourth quarter and the Citigroup Economic Surprise Index nears zero:
These labor softening developments warrant attention and public recognition from the Fed.
While 2023 consisted of higher-than-average inflation readings and reactionary rate hikes from the Fed to fulfill its “price stability” mandate, 2024 may consist of lower-than-average employment readings and reactionary rate cuts from the Fed to fulfill their “full employment” mandate. The game has changed.
Enjoy your weekend!
David S. Waddell
CEO, Chief Investment Strategist
Source: FRED, MishTalk, Bureau of Labor Statistics, Citigroup
This communication and its contents are for informational and educational purposes only and should not be used as the sole basis for any investment decision. The information contained herein is based on publicly available sources believed to be reliable but is not a representation, expressed or implied, as to the accuracy, completeness, or correctness of said information. Past performance does not guarantee future results.
" class="link-chevron">
Overall, while the Treasury yield rose 12% against year-ago levels, the S&P rose nearly 30%, challenging our calibration assertion. Upon closer inspection, however, there are clear patterns at work. Between October 1st, 2022, and July 30th, 2023, interest rates went nowhere. This afforded the market uplift as the Magnificent 7 AI frenzy took hold. Then, as we entered August, rates increased 30% against year-ago levels, leading to an 11% decline for the S&P 500. Fortunately, rates reversed on October 20th, igniting a powerful rally in the S&P, bringing it back to July’s highs. Clearly, there is causation between rates and stock market performance, but for more notable correlation, let’s examine investor sentiment:
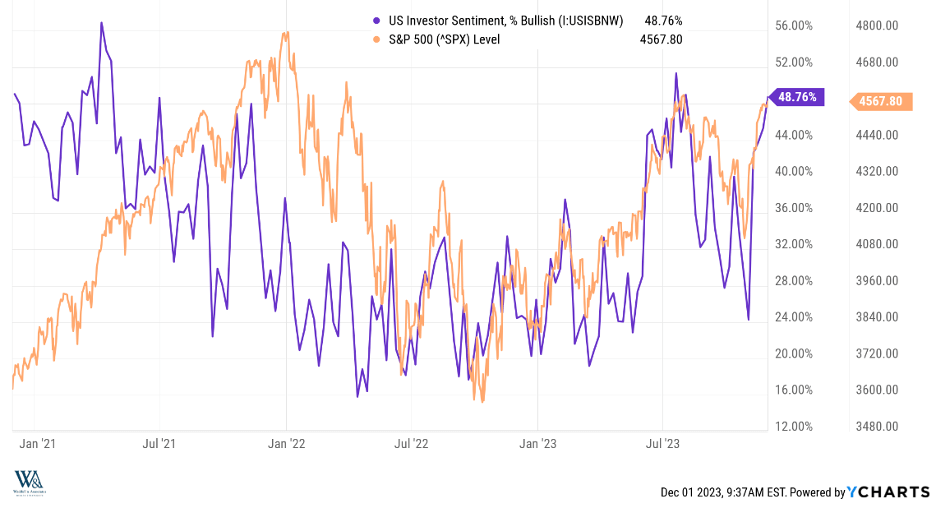
For this analysis, I zoomed out a little bit more for additional perspective. The purple line represents the percentage of retail investor survey respondents that describe themselves as “bullish”. The orange line represents the level of the S&P 500. Note that the correlations look loose on the left side of the chart as the market rose strongly in 2021 despite a steady decline in sentiment. Earnings growth offset the sentiment decline, with S&P 500 earnings up 49% that year.
Moving forward, as earnings growth dwindled, sentiment variations became more determinant. Study the lines from July, 2022 onward and you will see they nearly overlap! This high correlation pattern prompted our focus on sentiment levels as the most useful market forecasting tool. Our clients will recall our highly-contrarian, bullish outlook entering 2023. Low sentiment levels informed this projection.
Our clients will also recall a flurry of trading activity at the end of October as we harvested tax losses and repositioned portfolios in anticipation of a Santa Claus rally. Low sentiment levels informed this decision. In turn, the S&P 500 now stands 20% higher on the year and the November rally contributed half of that advance. With the 10-year Treasury rate now down to appropriate levels and sentiment back near July highs, has Santa Claus come and gone?
Earnings Returning
S&P 500 earnings grew more than 4% in the 3rd quarter of 2023, well above the -1% analysts expected prior to the reporting season. For the 4th quarter, analysts expect additional earnings growth of 3%. For the first quarter of 2024, they expect 6.5% growth, 10.4% growth in the second quarter and 12% growth for the full year. Analyst projections typically prove too conservative, as chronicled by the earnings surprise summary below:
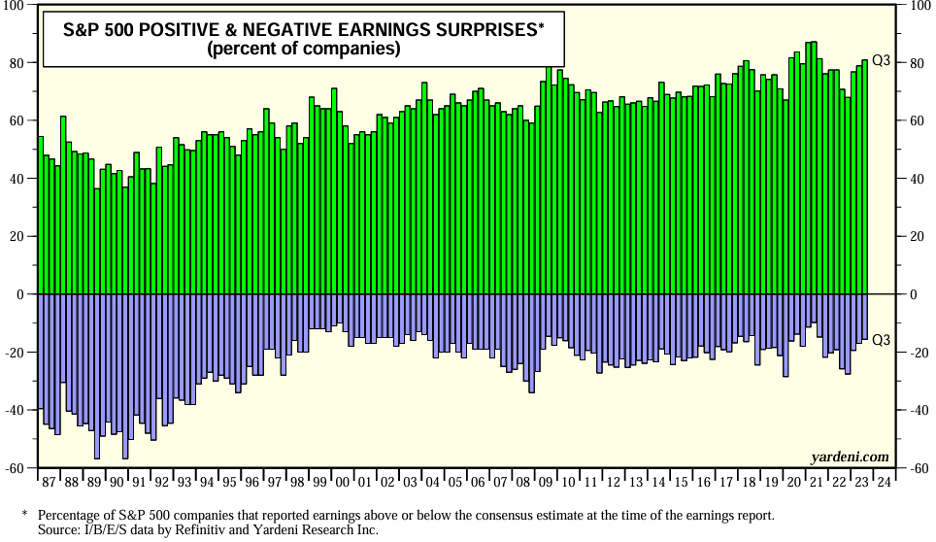
While many forecasters find it hard to imagine that earnings could grow substantially in 2024—and we are not ready to refute them just yet (much more work to do on our 2024 outlook)—history does support a bullish outlook for earnings based upon the expectations of today. Extrapolating last quarter’s upside earnings surprise level of 5% to the coming year, a 12% expected growth rate becomes a 17% real growth rate. That may seem nutty given the expected downshift in GDP, so cut those expectations in half. A 6% gain in earnings feels more achievable, but once you tack on the historic quarterly net upside surprise…
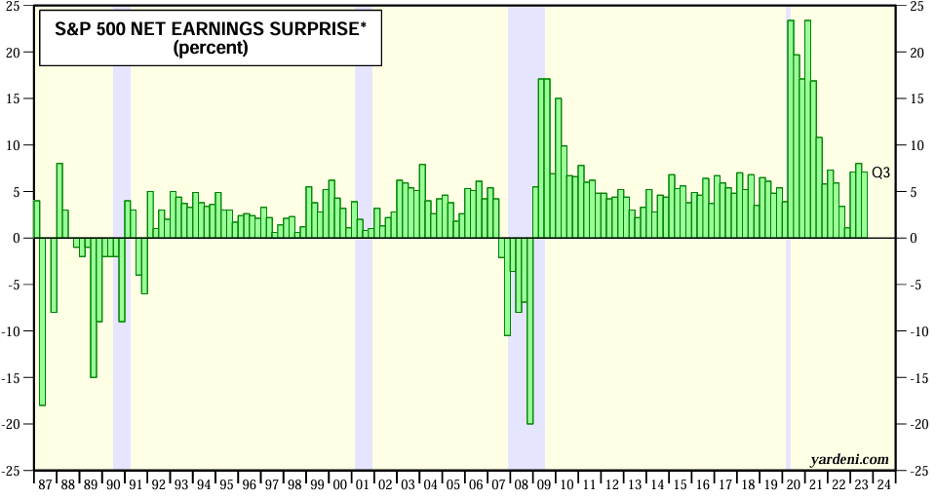
…You arrive right back above double digits (6% growth expectations, +5% surprise). Will this transpire? Unclear, but the return of earnings alone will reduce the S&P 500’s reliance on sentiment as we enter 2024. As strategists ponder what’s possible for 2024 earnings while they start populating their forecast models, fear of missing out could kick in to help offset a probable sentiment decline. 2023 was all about sentiment. 2024 will be all about earnings. Welcome back, big E!!
Have a fantastic week!
David S. Waddell
CEO, Chief Investment Strategist
Source: YCharts, Refinitiv, Yardeni
This communication and its contents are for informational and educational purposes only and should not be used as the sole basis for any investment decision. The information contained herein is based on publicly available sources believed to be reliable but is not a representation, expressed or implied, as to the accuracy, completeness, or correctness of said information. Past performance does not guarantee future results.
">Rally Resilience
Overall, while the Treasury yield rose 12% against year-ago levels, the S&P rose nearly 30%, challenging our calibration assertion. Upon closer inspection, however, there are clear patterns at work. Between October 1st, 2022, and July 30th, 2023, interest rates went nowhere. This afforded the market uplift as the Magnificent 7 AI frenzy took hold. Then, as we entered August, rates increased 30% against year-ago levels, leading to an 11% decline for the S&P 500. Fortunately, rates reversed on October 20th, igniting a powerful rally in the S&P, bringing it back to July’s highs. Clearly, there is causation between rates and stock market performance, but for more notable correlation, let’s examine investor sentiment:
For this analysis, I zoomed out a little bit more for additional perspective. The purple line represents the percentage of retail investor survey respondents that describe themselves as “bullish”. The orange line represents the level of the S&P 500. Note that the correlations look loose on the left side of the chart as the market rose strongly in 2021 despite a steady decline in sentiment. Earnings growth offset the sentiment decline, with S&P 500 earnings up 49% that year.
Moving forward, as earnings growth dwindled, sentiment variations became more determinant. Study the lines from July, 2022 onward and you will see they nearly overlap! This high correlation pattern prompted our focus on sentiment levels as the most useful market forecasting tool. Our clients will recall our highly-contrarian, bullish outlook entering 2023. Low sentiment levels informed this projection.
Our clients will also recall a flurry of trading activity at the end of October as we harvested tax losses and repositioned portfolios in anticipation of a Santa Claus rally. Low sentiment levels informed this decision. In turn, the S&P 500 now stands 20% higher on the year and the November rally contributed half of that advance. With the 10-year Treasury rate now down to appropriate levels and sentiment back near July highs, has Santa Claus come and gone?
Earnings Returning
S&P 500 earnings grew more than 4% in the 3rd quarter of 2023, well above the -1% analysts expected prior to the reporting season. For the 4th quarter, analysts expect additional earnings growth of 3%. For the first quarter of 2024, they expect 6.5% growth, 10.4% growth in the second quarter and 12% growth for the full year. Analyst projections typically prove too conservative, as chronicled by the earnings surprise summary below:
While many forecasters find it hard to imagine that earnings could grow substantially in 2024—and we are not ready to refute them just yet (much more work to do on our 2024 outlook)—history does support a bullish outlook for earnings based upon the expectations of today. Extrapolating last quarter’s upside earnings surprise level of 5% to the coming year, a 12% expected growth rate becomes a 17% real growth rate. That may seem nutty given the expected downshift in GDP, so cut those expectations in half. A 6% gain in earnings feels more achievable, but once you tack on the historic quarterly net upside surprise…
…You arrive right back above double digits (6% growth expectations, +5% surprise). Will this transpire? Unclear, but the return of earnings alone will reduce the S&P 500’s reliance on sentiment as we enter 2024. As strategists ponder what’s possible for 2024 earnings while they start populating their forecast models, fear of missing out could kick in to help offset a probable sentiment decline. 2023 was all about sentiment. 2024 will be all about earnings. Welcome back, big E!!
Have a fantastic week!
David S. Waddell
CEO, Chief Investment Strategist
Source: YCharts, Refinitiv, Yardeni
This communication and its contents are for informational and educational purposes only and should not be used as the sole basis for any investment decision. The information contained herein is based on publicly available sources believed to be reliable but is not a representation, expressed or implied, as to the accuracy, completeness, or correctness of said information. Past performance does not guarantee future results.
" class="link-chevron">
Unsurprisingly, much of that money found its way into bond funds, which have provided mixed results as yields have risen. However, recent data suggest equity investors have become more optimistic:
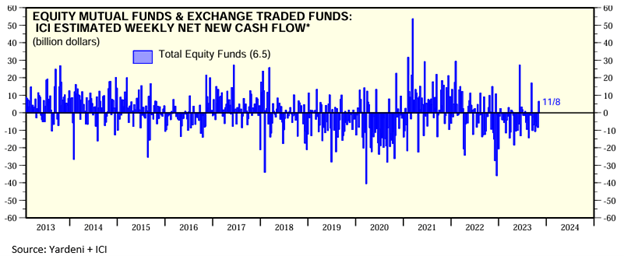
Over the past week, investors pumped $6.5 billion into equity funds helping to fuel Santa’s sleigh, the largest weekly inflow since June 14th and the third largest of the year. As retail investors have become more generous with their equity allocations, fund managers themselves have become more optimistic. In fact, according to the most recent Bank of America Fund Manager Survey, fund manager confidence in equities has hit its highest level in over a year and a half:
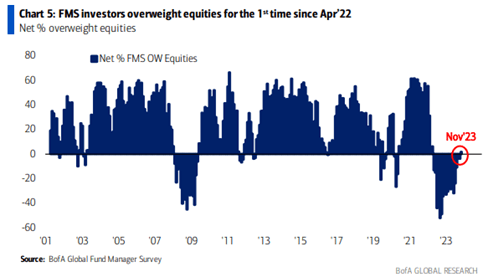
With recent retail and institutional confidence rising for US equities, we should examine how much flow potential resides in US money market funds.
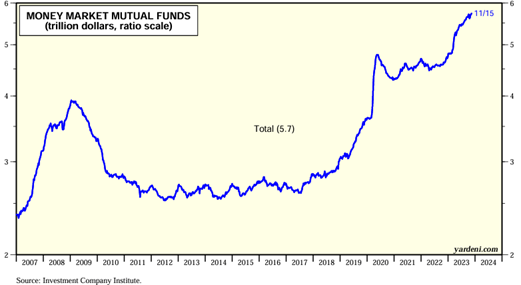
Wowza! Money Market funds recently reached a record high of $5.73 trillion. To put that number into perspective, the US equity market capitalization only totals $46 trillion, meaning that even a slight migration of these funds into US equities could add substantial uplift. But with Money Market Funds yielding north of 5%, why would investors move funds elsewhere? They may not… for now:
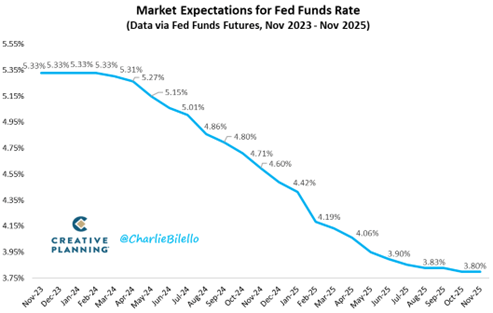
As disinflation trends become more credible, Fed rate cuts become more probable. Currently, Fed Funds futures have priced in no further rate increases for 2023 and nearly four rate cuts in 2025. By the end of 2025, the market expects a Fed Funds rate of less than 4%. As prospects for money market fund yields diminish, hurdle rates for equity fund returns diminish as well, making longer-term stock market allocations more attractive as shorter-term interest rates fall. For those wondering what could possibly power this market higher… just follow the flows!
Have a great weekend and a very Happy Thanksgiving!
David S. Waddell
CEO, Chief Investment Strategist
Source: Yardeni, Investment Company Institute, B of A Global Research, Creative Planning
This communication and its contents are for informational and educational purposes only and should not be used as the sole basis for any investment decision. The information contained herein is based on publicly available sources believed to be reliable but is not a representation, expressed or implied, as to the accuracy, completeness, or correctness of said information. Past performance does not guarantee future results.
">Go With the Flow
Unsurprisingly, much of that money found its way into bond funds, which have provided mixed results as yields have risen. However, recent data suggest equity investors have become more optimistic:
Over the past week, investors pumped $6.5 billion into equity funds helping to fuel Santa’s sleigh, the largest weekly inflow since June 14th and the third largest of the year. As retail investors have become more generous with their equity allocations, fund managers themselves have become more optimistic. In fact, according to the most recent Bank of America Fund Manager Survey, fund manager confidence in equities has hit its highest level in over a year and a half:
With recent retail and institutional confidence rising for US equities, we should examine how much flow potential resides in US money market funds.
Wowza! Money Market funds recently reached a record high of $5.73 trillion. To put that number into perspective, the US equity market capitalization only totals $46 trillion, meaning that even a slight migration of these funds into US equities could add substantial uplift. But with Money Market Funds yielding north of 5%, why would investors move funds elsewhere? They may not… for now:
As disinflation trends become more credible, Fed rate cuts become more probable. Currently, Fed Funds futures have priced in no further rate increases for 2023 and nearly four rate cuts in 2025. By the end of 2025, the market expects a Fed Funds rate of less than 4%. As prospects for money market fund yields diminish, hurdle rates for equity fund returns diminish as well, making longer-term stock market allocations more attractive as shorter-term interest rates fall. For those wondering what could possibly power this market higher… just follow the flows!
Have a great weekend and a very Happy Thanksgiving!
David S. Waddell
CEO, Chief Investment Strategist
Source: Yardeni, Investment Company Institute, B of A Global Research, Creative Planning
This communication and its contents are for informational and educational purposes only and should not be used as the sole basis for any investment decision. The information contained herein is based on publicly available sources believed to be reliable but is not a representation, expressed or implied, as to the accuracy, completeness, or correctness of said information. Past performance does not guarantee future results.
" class="link-chevron">
For this week, let’s zoom out a little further to see where the best risk/reward opportunities reside within this market for investors placing longer-term bets.
Allocation Deliberation
In the short run, markets are largely driven by tastes and preferences, making them particularly hard to predict. Fortunately, in the long run, as Buffett famously quipped, markets become a “weighing” machine rather than a “voting” machine. The outcomes become more predictable, and investable, as the below chart demonstrates:
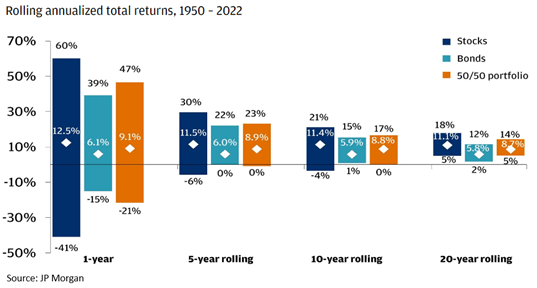
Since 1950, stocks have risen as much as 60% and fallen as much as 40% within 1-year periods. A return dispersion of 100%. Over the course of 20-year rolling periods, they have compounded as much as 18% and as little as 5%. A much narrower return dispersion of 23%. Also, note there have been no negative periods! As they say, it’s not TIMING the market; it’s time IN the market that counts. For long-term allocators, being invested in stocks makes dollars and sense. But which stocks?
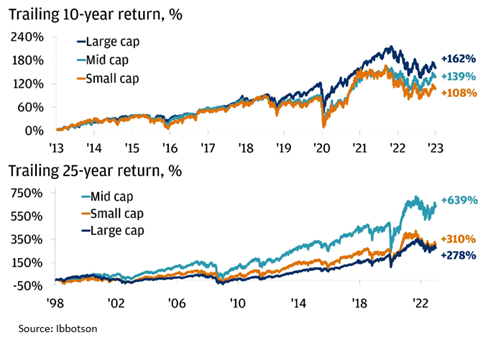
Buffet advocates investors hold Berkshire Hathaway while he is alive and then an S&P 500 large-cap index fund when he is dead. That’s reasonable advice, as it keeps investors invested and in a proven compounding machine. But should long-term investors expand allocations beyond the S&P 500? Over the last ten years, no. But over the last 25 years, yes:
At this point in time, how can investors know which index will perform best over the next 10-25 years? Many argue that the best indicator for future returns is entry point valuations:
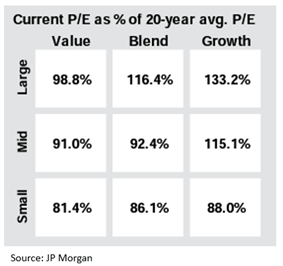
Currently, large caps sport valuations 16% higher than their 20-year average, while small caps hold valuations 14% lower than their 20-year average. By this comparison, investors should prioritize exposure to small-cap stocks over large-cap stocks within their portfolios.
Many also argue that earnings growth makes for the best indicator of future returns. By this measure, investors should prioritize large-cap stocks over small-cap stocks as analysts expect large-cap earnings to compound at 13.9% over the long term while small-cap earnings compound at 12.1%. While it may surprise some that the large caps have a higher expected earnings growth rate than the small caps, much of that can be explained by the breakaway earnings power of the of the infamous Magnificent 7 stocks (Apple, Meta, Microsoft, Nvidia, Amazon, Google, Tesla). These stocks comprise 30% of the large cap index. Therefore, their earnings growth rate heavily influences the index growth rate, and their monopolistic power provides a significant advantage.
While we should all agree that time in the market makes dollars and sense, those who favor entry point valuations and those who favor earnings growth expectations disagree over where to invest now. Wouldn’t it be nice if we could combine the two measures to break the tie? Fortunately, we can. The P/E to growth ratio (PEG) divides current valuations by expected growth rates to calculate how much investors pay per unit of earnings growth. For example, at a PEG of 1.0, investors pay $1 in value for each $1 of earnings growth. Seems fair. But, if valuations climb or earnings rates fall, investors may have to pay $2 in value for each $1 of earnings growth. Seems pricey. Conversely, if valuations fall or earnings rise, investors may only pay $.50 for each $1 of earnings growth. Bargain! Let’s calculate the current PEG ratios on offer and see what computes (while our focus is on US large and small caps I have added the internationals in for kicks, inference clear):
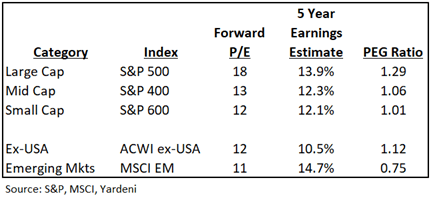
By combining valuation and earnings growth, we find that while large caps may have faster earnings growth, the valuation discount in small caps makes them 30% more attractive. But while smalls hold the advantage in comparison with large caps, we also need to compare their current PEG with their own historical PEG to finish our analysis:
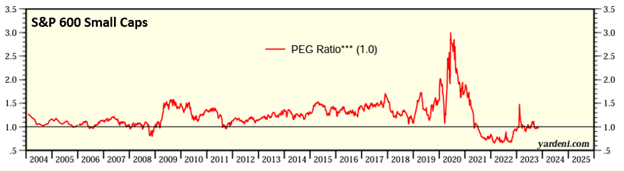
Based upon their own PEG ratio history, smaller cap stocks indices offer historic value. For investors placing savvy longer-term capital to work…the forgotten small caps should receive large consideration.
David S. Waddell
CEO, Chief Investment Strategist
Source: Yardeni, S&P, MSCI, JP Morgan, Ibbotson, StockTradersAlmanac.com
">PEG-ing This Market
For this week, let’s zoom out a little further to see where the best risk/reward opportunities reside within this market for investors placing longer-term bets.
Allocation Deliberation
In the short run, markets are largely driven by tastes and preferences, making them particularly hard to predict. Fortunately, in the long run, as Buffett famously quipped, markets become a “weighing” machine rather than a “voting” machine. The outcomes become more predictable, and investable, as the below chart demonstrates:
Since 1950, stocks have risen as much as 60% and fallen as much as 40% within 1-year periods. A return dispersion of 100%. Over the course of 20-year rolling periods, they have compounded as much as 18% and as little as 5%. A much narrower return dispersion of 23%. Also, note there have been no negative periods! As they say, it’s not TIMING the market; it’s time IN the market that counts. For long-term allocators, being invested in stocks makes dollars and sense. But which stocks?
Buffet advocates investors hold Berkshire Hathaway while he is alive and then an S&P 500 large-cap index fund when he is dead. That’s reasonable advice, as it keeps investors invested and in a proven compounding machine. But should long-term investors expand allocations beyond the S&P 500? Over the last ten years, no. But over the last 25 years, yes:
At this point in time, how can investors know which index will perform best over the next 10-25 years? Many argue that the best indicator for future returns is entry point valuations:
Currently, large caps sport valuations 16% higher than their 20-year average, while small caps hold valuations 14% lower than their 20-year average. By this comparison, investors should prioritize exposure to small-cap stocks over large-cap stocks within their portfolios.
Many also argue that earnings growth makes for the best indicator of future returns. By this measure, investors should prioritize large-cap stocks over small-cap stocks as analysts expect large-cap earnings to compound at 13.9% over the long term while small-cap earnings compound at 12.1%. While it may surprise some that the large caps have a higher expected earnings growth rate than the small caps, much of that can be explained by the breakaway earnings power of the of the infamous Magnificent 7 stocks (Apple, Meta, Microsoft, Nvidia, Amazon, Google, Tesla). These stocks comprise 30% of the large cap index. Therefore, their earnings growth rate heavily influences the index growth rate, and their monopolistic power provides a significant advantage.
While we should all agree that time in the market makes dollars and sense, those who favor entry point valuations and those who favor earnings growth expectations disagree over where to invest now. Wouldn’t it be nice if we could combine the two measures to break the tie? Fortunately, we can. The P/E to growth ratio (PEG) divides current valuations by expected growth rates to calculate how much investors pay per unit of earnings growth. For example, at a PEG of 1.0, investors pay $1 in value for each $1 of earnings growth. Seems fair. But, if valuations climb or earnings rates fall, investors may have to pay $2 in value for each $1 of earnings growth. Seems pricey. Conversely, if valuations fall or earnings rise, investors may only pay $.50 for each $1 of earnings growth. Bargain! Let’s calculate the current PEG ratios on offer and see what computes (while our focus is on US large and small caps I have added the internationals in for kicks, inference clear):
By combining valuation and earnings growth, we find that while large caps may have faster earnings growth, the valuation discount in small caps makes them 30% more attractive. But while smalls hold the advantage in comparison with large caps, we also need to compare their current PEG with their own historical PEG to finish our analysis:
Based upon their own PEG ratio history, smaller cap stocks indices offer historic value. For investors placing savvy longer-term capital to work…the forgotten small caps should receive large consideration.
David S. Waddell
CEO, Chief Investment Strategist
Source: Yardeni, S&P, MSCI, JP Morgan, Ibbotson, StockTradersAlmanac.com
" class="link-chevron">
Last week, we received word that the US economy grew 4.9% in the third quarter. Consumer spending (amplified by Swifty Stimulus) powered the bulk of that advance. For US GDP growth to continue growing, consumers must continue spending.
While savings depletion and credit usage add to spending, it’s jobs and wages that drive it. Therefore, strength in the job market drives strength in spending, strength across the economy, and strength in corporate earnings.
The headline above refers to the Job Openings and Labor Turnover Survey released on Wednesday by the US Bureau of Labor Statistics. According to the report, job openings rose slightly over the previous month to 9.6 million, equating to 1.5 jobs available for each unemployed worker. This remains a very strong job market, but the market has trended back toward more balanced conditions between worker supply and worker demand as the following chart demonstrates:
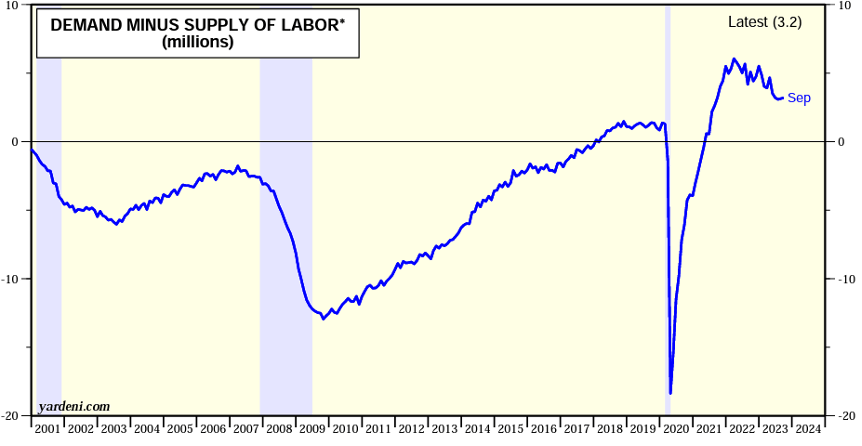
Powell has cited reclamation of equilibrium between labor supply and labor demand as one of his primary objectives. As you can see, while demand still outstrips supply, conditions are trending towards desired equilibrium.
As referenced in the headline, while jobs remain plentiful, quit rates and layoffs have hit pre-pandemic levels. Quit rates matter to economists because they measure worker confidence. You will only ballad, “take this job and shove it” if you know that another, better paying job is available.
The less workers believe that the grass is greener, the fewer quits and wage renegotiations. Employers also pink-slipped 1% of laborers, consistent with a steady but forgiving environment. So, while the economy added jobs in September, quit rates and layoff rates suggest easing wage pressures. This Goldilocks report gets a 10 out of 10.

Reinforcing the JOLTS suggestion of softening wage conditions, the Labor Department also released its quarterly report on productivity and unit labor costs. Within the 3rd quarter, unit labor costs increased 3.9%, but labor productivity surged by 4.7%. This means corporations generated 4.7% more stuff and only had to pay workers 3.9% for it. That translates into a decline in unit labor costs of 0.8%!
In economics, nothing provides more benefit to society than increasing productivity. Productivity gains power quality of life gains as less input generates more output. Productivity in the US has surged over the last two quarters to its highest levels in 15 years (save the pandemic surge due to mass layoffs) as labor and supply shortages forced companies to innovate processes and renovate organizational structures:
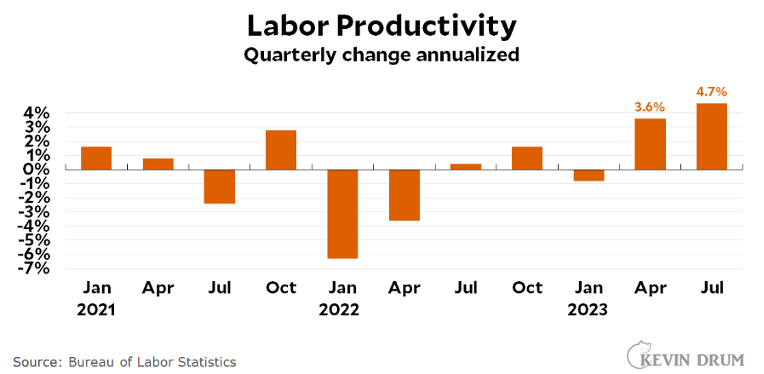
Mix in the early integration of AI, and the US may have just entered a major productivity upgrade cycle. As corporations become more efficient, economies grow without corresponding inflation growth. This Goldilocks report also receives a 10 out of 10.

Strong economic growth, high productivity and lower wage pressures should alchemize into higher corporate earnings reports. And so, they have! S&P 500 earnings likely hit record levels last quarter. So far, 341 of the 500 companies within the S&P 500 have reported with aggregate earnings growth now projected at 3.4% versus the -1% anticipated before the reporting season began. Furthermore, the resumption of growth rather than declines should continue unabated next year as seen in the estimates below:
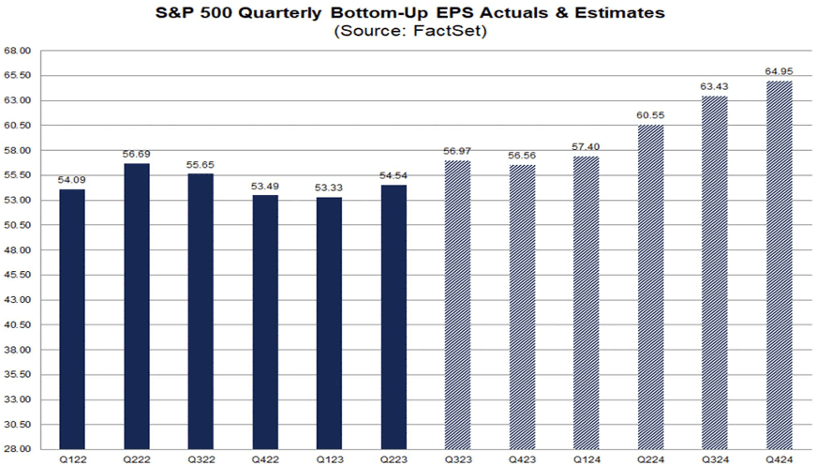
Using simple arithmetic, if we annualize the Q4 2024 projection of $65 in earnings per share for the S&P 500, we get $260. With interest rates cooling back toward 4.5% on the 10-year, the market could easily support a 19x P/E.
Multiplying $260 by 19 produces a potential price level near $5,000 for the index next year. We closed Friday near $4,350. After three consecutive quarters of negative earnings growth, the initiation of positive growth this quarter, and for quarters to come, receives another Goldilocks 10 out of 10.

Of all the happy headlines this week, none provided more rally fuel than this one. A fierce debate has broken out among economic disciplinarians around the ability of the global marketplace to finance ballooning fiscal deficits in the US. The spike in long-term interest rates over the past quarter corresponded with a large surprise in scheduled treasury auctions, and underwhelming demand for longer dated maturities. Fortunately, the Treasury took notice.
On Wednesday, the Treasury announced that it will issue fewer bonds than expected this quarter and will weight issuance toward shorter dated maturities, removing upward yield pressure on longer-dated maturities. The yield on the 10-year bond dropped from 4.8% to 4.57%, sparking a stock market surge as lower yields accommodate higher valuations and lower funding costs boost earnings potential. We do not comment on the Treasury Refunding releases often, but this Goldilocks market mover received a 10 out of 10.

Bravo, Chairman Powell! Your FOMC comments and press conference provided EXACTLY what this rally needed to break out of jail. To summarize his comments:
- Disinflation across the economy remains on trend.
- Labor market growth remains on trend.
- Labor inflation has now returned to levels consistent with our 2% inflation target.
- Labor demand and supply factors are rebalancing, a healthy precondition for disinflation.
- GDP growth rates are averaging out below potential, a healthy precondition for disinflation.
- We do not see a recession on the horizon.
- Longer-term inflation expectations remain near our 2% target.
- The recent rise in the dollar, the rise in yields, and the fall in the stock markets have tightened financial conditions organically, reducing tighter policy requirements.
- We do not see any need to raise rates further or cut rates at this time.
- We do not believe the events in the Middle East will impact the economy.
Standing ovation, please! Often, Fed Chairs tilt their comments to punish or reward markets. What made this testimony so compelling was Powell’s synthesis of truth. As seen in the headlines above, his comments align with the positive indicators of growth and disinflation recently reported. The market needed a jolt of confidence, but this was no manipulation. I will end this section with the following Goldilocks revelation he made during his 10-out-of-10 press conference:
“Well, I think everyone has been very gratified to see that we’ve been able to achieve, you know, pretty significant progress on inflation without seeing the kind of increase in unemployment that has been very typical of rate-hiking cycles like this one. That’s historically unusual and a very welcome result.”
Indeed, Mr. Powell!
David S. Waddell
CEO, Chief Investment Strategist
Source: Yardeni, FactSet, Bureau of Labor Statistics
This communication and its contents are for informational and educational purposes only and should not be used as the sole basis for any investment decision. The information contained herein is based on publicly available sources believed to be reliable but is not a representation, expressed or implied, as to the accuracy, completeness, or correctness of said information. Past performance does not guarantee future results.
">Get Your Happy Headlines Here!
Last week, we received word that the US economy grew 4.9% in the third quarter. Consumer spending (amplified by Swifty Stimulus) powered the bulk of that advance. For US GDP growth to continue growing, consumers must continue spending.
While savings depletion and credit usage add to spending, it’s jobs and wages that drive it. Therefore, strength in the job market drives strength in spending, strength across the economy, and strength in corporate earnings.
The headline above refers to the Job Openings and Labor Turnover Survey released on Wednesday by the US Bureau of Labor Statistics. According to the report, job openings rose slightly over the previous month to 9.6 million, equating to 1.5 jobs available for each unemployed worker. This remains a very strong job market, but the market has trended back toward more balanced conditions between worker supply and worker demand as the following chart demonstrates:
Powell has cited reclamation of equilibrium between labor supply and labor demand as one of his primary objectives. As you can see, while demand still outstrips supply, conditions are trending towards desired equilibrium.
As referenced in the headline, while jobs remain plentiful, quit rates and layoffs have hit pre-pandemic levels. Quit rates matter to economists because they measure worker confidence. You will only ballad, “take this job and shove it” if you know that another, better paying job is available.
The less workers believe that the grass is greener, the fewer quits and wage renegotiations. Employers also pink-slipped 1% of laborers, consistent with a steady but forgiving environment. So, while the economy added jobs in September, quit rates and layoff rates suggest easing wage pressures. This Goldilocks report gets a 10 out of 10.
Reinforcing the JOLTS suggestion of softening wage conditions, the Labor Department also released its quarterly report on productivity and unit labor costs. Within the 3rd quarter, unit labor costs increased 3.9%, but labor productivity surged by 4.7%. This means corporations generated 4.7% more stuff and only had to pay workers 3.9% for it. That translates into a decline in unit labor costs of 0.8%!
In economics, nothing provides more benefit to society than increasing productivity. Productivity gains power quality of life gains as less input generates more output. Productivity in the US has surged over the last two quarters to its highest levels in 15 years (save the pandemic surge due to mass layoffs) as labor and supply shortages forced companies to innovate processes and renovate organizational structures:
Mix in the early integration of AI, and the US may have just entered a major productivity upgrade cycle. As corporations become more efficient, economies grow without corresponding inflation growth. This Goldilocks report also receives a 10 out of 10.
Strong economic growth, high productivity and lower wage pressures should alchemize into higher corporate earnings reports. And so, they have! S&P 500 earnings likely hit record levels last quarter. So far, 341 of the 500 companies within the S&P 500 have reported with aggregate earnings growth now projected at 3.4% versus the -1% anticipated before the reporting season began. Furthermore, the resumption of growth rather than declines should continue unabated next year as seen in the estimates below:
Using simple arithmetic, if we annualize the Q4 2024 projection of $65 in earnings per share for the S&P 500, we get $260. With interest rates cooling back toward 4.5% on the 10-year, the market could easily support a 19x P/E.
Multiplying $260 by 19 produces a potential price level near $5,000 for the index next year. We closed Friday near $4,350. After three consecutive quarters of negative earnings growth, the initiation of positive growth this quarter, and for quarters to come, receives another Goldilocks 10 out of 10.
Of all the happy headlines this week, none provided more rally fuel than this one. A fierce debate has broken out among economic disciplinarians around the ability of the global marketplace to finance ballooning fiscal deficits in the US. The spike in long-term interest rates over the past quarter corresponded with a large surprise in scheduled treasury auctions, and underwhelming demand for longer dated maturities. Fortunately, the Treasury took notice.
On Wednesday, the Treasury announced that it will issue fewer bonds than expected this quarter and will weight issuance toward shorter dated maturities, removing upward yield pressure on longer-dated maturities. The yield on the 10-year bond dropped from 4.8% to 4.57%, sparking a stock market surge as lower yields accommodate higher valuations and lower funding costs boost earnings potential. We do not comment on the Treasury Refunding releases often, but this Goldilocks market mover received a 10 out of 10.
Bravo, Chairman Powell! Your FOMC comments and press conference provided EXACTLY what this rally needed to break out of jail. To summarize his comments:
- Disinflation across the economy remains on trend.
- Labor market growth remains on trend.
- Labor inflation has now returned to levels consistent with our 2% inflation target.
- Labor demand and supply factors are rebalancing, a healthy precondition for disinflation.
- GDP growth rates are averaging out below potential, a healthy precondition for disinflation.
- We do not see a recession on the horizon.
- Longer-term inflation expectations remain near our 2% target.
- The recent rise in the dollar, the rise in yields, and the fall in the stock markets have tightened financial conditions organically, reducing tighter policy requirements.
- We do not see any need to raise rates further or cut rates at this time.
- We do not believe the events in the Middle East will impact the economy.
Standing ovation, please! Often, Fed Chairs tilt their comments to punish or reward markets. What made this testimony so compelling was Powell’s synthesis of truth. As seen in the headlines above, his comments align with the positive indicators of growth and disinflation recently reported. The market needed a jolt of confidence, but this was no manipulation. I will end this section with the following Goldilocks revelation he made during his 10-out-of-10 press conference:
“Well, I think everyone has been very gratified to see that we’ve been able to achieve, you know, pretty significant progress on inflation without seeing the kind of increase in unemployment that has been very typical of rate-hiking cycles like this one. That’s historically unusual and a very welcome result.”
Indeed, Mr. Powell!
David S. Waddell
CEO, Chief Investment Strategist
Source: Yardeni, FactSet, Bureau of Labor Statistics
This communication and its contents are for informational and educational purposes only and should not be used as the sole basis for any investment decision. The information contained herein is based on publicly available sources believed to be reliable but is not a representation, expressed or implied, as to the accuracy, completeness, or correctness of said information. Past performance does not guarantee future results.
" class="link-chevron">