Third Quarter, 2024
Ch-Ch-Ch-Ch Changes, Oh Yeah!
The only constant in our lives is change. As musical legend David Bowie once said, “Ch-ch-ch-ch changes! Turn and face the strange.” The song hints that the best path is to embrace the strange, unwelcome, or opportunistic changes life throws us. Although “Changes” was not released until 1972, Bowie penned it in 1969 near the height of the social and political turmoil of the 1970s—sound familiar?
Our passion as wealth strategists at Waddell & Associates is to help you navigate changes more skillfully. Not just in your investment portfolios, but more importantly, in all of these other areas:
- Health and aging – your own and that of your loved ones and friends.
- Change in residency – whether to rent or buy.
- Whether to spend or save, or both. Whether to buy or sell, when and why.
- Financing choices – borrowing, how & when? Pay off mortgage or re-finance?
- How to adjust to rising or falling interest rates? Changes to your income.
- Changes in employment: when to retire, semi-retire, or start a new career?
- How to navigate divorce, sickness, or loss of a spouse, partner, loved one, pet, or friend.
- Aging at home or in a retirement community for your loved ones, or for you?
- Estate planning – do you want to leave a legacy? When is it best to consider charitable giving and how should you start?
- Inheritances and gifting — assessing the consequences of how you name beneficiaries.
- Analyzing the importance and effects of taxes on these decisions.
BOTTOM LINE: Ch-ch-ch-ch changes. Rely on the credentialed and experienced wealth strategists at W&A to help you skillfully face changes, oh yeah!
-Phyllis
Sources: Wikipedia; vocal.media
">Ch-Ch-Ch-Ch Changes, Oh Yeah! Third Quarter, 2024Ch-Ch-Ch-Ch Changes, Oh Yeah!
The only constant in our lives is change. As musical legend David Bowie once said, “Ch-ch-ch-ch changes! Turn and face the strange.” The song hints that the best path is to embrace the strange, unwelcome, or opportunistic changes life throws us. Although “Changes” was not released until 1972, Bowie penned it in 1969 near the height of the social and political turmoil of the 1970s—sound familiar?
Our passion as wealth strategists at Waddell & Associates is to help you navigate changes more skillfully. Not just in your investment portfolios, but more importantly, in all of these other areas:
- Health and aging – your own and that of your loved ones and friends.
- Change in residency – whether to rent or buy.
- Whether to spend or save, or both. Whether to buy or sell, when and why.
- Financing choices – borrowing, how & when? Pay off mortgage or re-finance?
- How to adjust to rising or falling interest rates? Changes to your income.
- Changes in employment: when to retire, semi-retire, or start a new career?
- How to navigate divorce, sickness, or loss of a spouse, partner, loved one, pet, or friend.
- Aging at home or in a retirement community for your loved ones, or for you?
- Estate planning – do you want to leave a legacy? When is it best to consider charitable giving and how should you start?
- Inheritances and gifting — assessing the consequences of how you name beneficiaries.
- Analyzing the importance and effects of taxes on these decisions.
BOTTOM LINE: Ch-ch-ch-ch changes. Rely on the credentialed and experienced wealth strategists at W&A to help you skillfully face changes, oh yeah!
-Phyllis
Sources: Wikipedia; vocal.media
" class="link-chevron">
This week marked a continuation of the current stock market rally into record territory. Jerome Powell’s bold .50% rate cut boosted markets last week and gained further validation on Friday as the Bureau of Economic Analysis reported annual inflation of just 2.2% across the US economy. Nearer-term measures add even further validation that Jerome cut correctly:

The Fed will meet again a mere 40 days from today and futures markets place a 53% probability of another .50% cut. We continue to favor bold action from the Fed, as will the markets, but this week’s boost came from offshore. China unleashed a cornucopia of stimulus to jumpstart their sagging economy.
Before we get to the specifics and implications, let’s revisit some rules of thumb when considering China. First, the #1 goal of the Communist Party in China is to stay in power. There are 1.4 billion Chinese citizens. Rising prosperity leads to rising political opinion. This has been the grand bargain between the Party and the people. Falling prosperity invites political scrutiny and rising civil unrest. China spends more on domestic security than national defense, indicating that the Party sees the larger existential threat inside its borders, not outside. For this reason, economic growth is a matter of self-preservation.
Unfortunately, the Chinese economic model needs restructuring away from state-owned build and export to privately-owned serve and consume. Rapid urbanization powered the domestic economy for decades, but structural overcapacity has led to deflating property values and defaulting developers. Consider the composition of Chinese household balance sheets vs. US household balance sheets:

US households have 27% of their net worth tied up in property, while Chinese households have 59% of their net worth tied up in property. Now look at recent property price trends:

In sum, the world’s largest population has the largest portion of household assets in depreciating real estate assets, leading to a record low in consumer sentiment measures, and heightened political concerns within the Chinese Communist Party. Cue the stimulus!
(I asked Matt Gentzkow, an investment strategist within W&A, to write me an internal memo on the Chinese stimulus announcement and found it so well done that I have included it verbatim below. Well done, Matt!)
What is going on in China?
“If you’ve got a bazooka, and people know you’ve got it, you may not have to take it out.” – US Treasury Secretary Hank Paulson, July 2008
While Jerome Powell started the US rate cut regime last week to steer the US economy towards a successful ‘soft landing,’ the Chinese economy has already crash-landed, and their government is using its tools to stimulate a deteriorating economy. This week, China announced a fiscal stimulus of 2 trillion Yuan (or ~ USD 285 billion) aimed at increasing consumer consumption and helping local municipalities reduce debt load while also reducing reserve requirements for banks by 0.5% to encourage lending. In theory, this allows banks to lend more to consumers who use that money to buy goods or assets, boosting GDP.
Immediately following these emergency policy measures, the government signaled further fiscal support through unnamed government sources and various US media outlets. This reminds me of the quote above, when amidst the 2008 Global Financial Crisis, then US Treasury Secretary (and former Goldman Sachs CEO) Hank Paulson hoped that signaling of drastic fiscal measures would help calm market participants. Of course, we know from history that Hank Paulson ultimately did take out his bazooka to save the US economy.
What do the markets think?
Well, the good news: The Chinese stock market (measured by the Shanghai Composite Index) has rallied over 12% this week on the stimulus news. But what does this mean for investors going forward? An accommodative fiscal policy will certainly help the Chinese economy and asset prices, but we also need to remember that publicly traded equity markets like when economic growth is positive and accelerating.

For example, peek at the chart above. From 2000 through 2007, China’s reported GDP was positive and accelerating in rate of change terms. Not surprisingly, the MSCI China Total Return Index was up 212% over the same time frame!

However, GDP growth has been mostly decelerating in rate of change terms since 2008, which has corresponded to a paltry 9.76% total return since 2008.

For the first part of the 21st century, China was a wonderful growth story, and investors were paid handsome returns; however, as economic growth rates have slowed, so have local equity markets. China has been easing economic conditions now for a few years post Covid-19 pandemic, but they have no choice but to bring out the ‘bazooka’ in months to come as they attempt to re-ignite an acceleration in economic growth and lift asset prices.
Have a great week!
-David
Sources: U.S. Bureau of Economic Analysis, Allianz, CEIC, NBS ING, Y Charts, National Bureau of Statistics, Bloomberg
This communication and its contents are for informational and educational purposes only and should not be used as the sole basis for any investment decision. The information contained herein is based on publicly available sources believed to be reliable but is not a representation, expressed or implied, as to the accuracy, completeness, or correctness of said information. Past performance does not guarantee future results.
">Thanks, China!
This week marked a continuation of the current stock market rally into record territory. Jerome Powell’s bold .50% rate cut boosted markets last week and gained further validation on Friday as the Bureau of Economic Analysis reported annual inflation of just 2.2% across the US economy. Nearer-term measures add even further validation that Jerome cut correctly:
The Fed will meet again a mere 40 days from today and futures markets place a 53% probability of another .50% cut. We continue to favor bold action from the Fed, as will the markets, but this week’s boost came from offshore. China unleashed a cornucopia of stimulus to jumpstart their sagging economy.
Before we get to the specifics and implications, let’s revisit some rules of thumb when considering China. First, the #1 goal of the Communist Party in China is to stay in power. There are 1.4 billion Chinese citizens. Rising prosperity leads to rising political opinion. This has been the grand bargain between the Party and the people. Falling prosperity invites political scrutiny and rising civil unrest. China spends more on domestic security than national defense, indicating that the Party sees the larger existential threat inside its borders, not outside. For this reason, economic growth is a matter of self-preservation.
Unfortunately, the Chinese economic model needs restructuring away from state-owned build and export to privately-owned serve and consume. Rapid urbanization powered the domestic economy for decades, but structural overcapacity has led to deflating property values and defaulting developers. Consider the composition of Chinese household balance sheets vs. US household balance sheets:
US households have 27% of their net worth tied up in property, while Chinese households have 59% of their net worth tied up in property. Now look at recent property price trends:
In sum, the world’s largest population has the largest portion of household assets in depreciating real estate assets, leading to a record low in consumer sentiment measures, and heightened political concerns within the Chinese Communist Party. Cue the stimulus!
(I asked Matt Gentzkow, an investment strategist within W&A, to write me an internal memo on the Chinese stimulus announcement and found it so well done that I have included it verbatim below. Well done, Matt!)
What is going on in China?
“If you’ve got a bazooka, and people know you’ve got it, you may not have to take it out.” – US Treasury Secretary Hank Paulson, July 2008
While Jerome Powell started the US rate cut regime last week to steer the US economy towards a successful ‘soft landing,’ the Chinese economy has already crash-landed, and their government is using its tools to stimulate a deteriorating economy. This week, China announced a fiscal stimulus of 2 trillion Yuan (or ~ USD 285 billion) aimed at increasing consumer consumption and helping local municipalities reduce debt load while also reducing reserve requirements for banks by 0.5% to encourage lending. In theory, this allows banks to lend more to consumers who use that money to buy goods or assets, boosting GDP.
Immediately following these emergency policy measures, the government signaled further fiscal support through unnamed government sources and various US media outlets. This reminds me of the quote above, when amidst the 2008 Global Financial Crisis, then US Treasury Secretary (and former Goldman Sachs CEO) Hank Paulson hoped that signaling of drastic fiscal measures would help calm market participants. Of course, we know from history that Hank Paulson ultimately did take out his bazooka to save the US economy.
What do the markets think?
Well, the good news: The Chinese stock market (measured by the Shanghai Composite Index) has rallied over 12% this week on the stimulus news. But what does this mean for investors going forward? An accommodative fiscal policy will certainly help the Chinese economy and asset prices, but we also need to remember that publicly traded equity markets like when economic growth is positive and accelerating.
For example, peek at the chart above. From 2000 through 2007, China’s reported GDP was positive and accelerating in rate of change terms. Not surprisingly, the MSCI China Total Return Index was up 212% over the same time frame!
However, GDP growth has been mostly decelerating in rate of change terms since 2008, which has corresponded to a paltry 9.76% total return since 2008.
For the first part of the 21st century, China was a wonderful growth story, and investors were paid handsome returns; however, as economic growth rates have slowed, so have local equity markets. China has been easing economic conditions now for a few years post Covid-19 pandemic, but they have no choice but to bring out the ‘bazooka’ in months to come as they attempt to re-ignite an acceleration in economic growth and lift asset prices.
Have a great week!
-David
Sources: U.S. Bureau of Economic Analysis, Allianz, CEIC, NBS ING, Y Charts, National Bureau of Statistics, Bloomberg
This communication and its contents are for informational and educational purposes only and should not be used as the sole basis for any investment decision. The information contained herein is based on publicly available sources believed to be reliable but is not a representation, expressed or implied, as to the accuracy, completeness, or correctness of said information. Past performance does not guarantee future results.
" class="link-chevron">The Fed has identified 3% as the neutral policy rate, implying 2.5% of policy restriction just to return to even. While many on the committee prefer a “safer,” more incremental wait-and-see approach to cutting rates, the numbers and the logic argue for a bolder response. It is time for Powell to shed the committee, assert his leadership, and produce. On Wednesday he did just that, inciting the first committee member dissenting vote since 2005.
The Fed cut the overnight interest rate from 5.5% to 5%. A 0.5% cut to begin the cycle amidst committee incrementalism and political scrutiny declares that Powell has the power. Investors initially cheered the move, then reconsidered as a close study of the committee’s projections show a projected three-year timeframe to reach neutral. We agree. But with Powell now leading, rather than following the committee, we suspect a steeper downslope than that.
Why risk recession with inflation whipped?
Powell’s term ends on February 5th, 2026. Few Fed Chairs have achieved a “soft landing” after running a restrictive policy regime. If Powell can forestall recession for the next 17 months, he will secure his legacy as one of them. Powell’s legacy pursuit and leadership assertion provide investors with powerful support. FOMC member Michelle Bowman voted against the 0.50% cut. Powell reacted by stating in the press conference, “There’s nothing wrong with dissents, and if it happens, it happens.” Cue Thursday’s all-time highs.
While we welcome Powell’s rally support, we should not overlook the threat of his opponent. The Fed has now recalibrated efforts from fighting inflation to fighting recession. As investors, we prefer an inflation fight to a recession fight. Historically, stocks perform well in inflationary times. Stocks do not perform well in recessionary times.
Markets may have cheered weak economic data releases during the inflation fight, but they will not cheer weak economic data releases during the recession fight. This invites more anxiety and downward volatility. And while Powell cut the overnight rate 0.5% on Wednesday, the market drove the 10 Year Treasury yield up 0.15%, partially offsetting the stimulus. Recession odds remain low at this point, but risks have risen. A Powell-led soft landing remains our base case, and we have calibrated our investments toward higher earnings and lower rates. For now, markets agree:

Economic growth and lower rates should benefit interest rate-sensitive groups like financials and small caps the most. Economic growth and lower rates should also lower the US dollar and boost international stocks. As seen above, small caps, financials, and internationals have all outperformed the S&P 500 since June 30th. To fund these advances, investors have added cash and proceeds from the previously undefeated Magnificent 7 stocks.
As we watch the macroeconomic data trends vigilantly, we must also scour the macromarket trends for confirmation. As of this writing, the economic and market data agree. Inflation is falling, rates are falling, the economy is growing, and Powell’s legacy pursuit provides powerful recession insurance.
Have a great week!
– David
Sources: Y Charts, https://www.federalreserve.gov/monetarypolicy/files/fomcprojtabl20240918.pdf
This communication and its contents are for informational and educational purposes only and should not be used as the sole basis for any investment decision. The information contained herein is based on publicly available sources believed to be reliable but is not a representation, expressed or implied, as to the accuracy, completeness, or correctness of said information. Past performance does not guarantee future results.
">
Those of you who viewed our 2024 Halftime Report will recall that we designated the conflict between the backward-looking FOMC and the forward-looking Jerome Powell as the biggest risk to the economy and the markets. The Fed has two mandates: maintain stable prices and support full employment. Currently, headline inflation measures have downward momentum, while unemployment measures have upward momentum. Based upon the mandate, the Fed should be considering a policy tilt towards accommodation, and yet, at 5.5%, policy sits at highly restrictive levels.
The Fed has identified 3% as the neutral policy rate, implying 2.5% of policy restriction just to return to even. While many on the committee prefer a “safer,” more incremental wait-and-see approach to cutting rates, the numbers and the logic argue for a bolder response. It is time for Powell to shed the committee, assert his leadership, and produce. On Wednesday he did just that, inciting the first committee member dissenting vote since 2005.
The Fed cut the overnight interest rate from 5.5% to 5%. A 0.5% cut to begin the cycle amidst committee incrementalism and political scrutiny declares that Powell has the power. Investors initially cheered the move, then reconsidered as a close study of the committee’s projections show a projected three-year timeframe to reach neutral. We agree. But with Powell now leading, rather than following the committee, we suspect a steeper downslope than that.
Why risk recession with inflation whipped?
Powell’s term ends on February 5th, 2026. Few Fed Chairs have achieved a “soft landing” after running a restrictive policy regime. If Powell can forestall recession for the next 17 months, he will secure his legacy as one of them. Powell’s legacy pursuit and leadership assertion provide investors with powerful support. FOMC member Michelle Bowman voted against the 0.50% cut. Powell reacted by stating in the press conference, “There’s nothing wrong with dissents, and if it happens, it happens.” Cue Thursday’s all-time highs.
While we welcome Powell’s rally support, we should not overlook the threat of his opponent. The Fed has now recalibrated efforts from fighting inflation to fighting recession. As investors, we prefer an inflation fight to a recession fight. Historically, stocks perform well in inflationary times. Stocks do not perform well in recessionary times.
Markets may have cheered weak economic data releases during the inflation fight, but they will not cheer weak economic data releases during the recession fight. This invites more anxiety and downward volatility. And while Powell cut the overnight rate 0.5% on Wednesday, the market drove the 10 Year Treasury yield up 0.15%, partially offsetting the stimulus. Recession odds remain low at this point, but risks have risen. A Powell-led soft landing remains our base case, and we have calibrated our investments toward higher earnings and lower rates. For now, markets agree:
Economic growth and lower rates should benefit interest rate-sensitive groups like financials and small caps the most. Economic growth and lower rates should also lower the US dollar and boost international stocks. As seen above, small caps, financials, and internationals have all outperformed the S&P 500 since June 30th. To fund these advances, investors have added cash and proceeds from the previously undefeated Magnificent 7 stocks.
As we watch the macroeconomic data trends vigilantly, we must also scour the macromarket trends for confirmation. As of this writing, the economic and market data agree. Inflation is falling, rates are falling, the economy is growing, and Powell’s legacy pursuit provides powerful recession insurance.
Have a great week!
– David
Sources: Y Charts, https://www.federalreserve.gov/monetarypolicy/files/fomcprojtabl20240918.pdf
This communication and its contents are for informational and educational purposes only and should not be used as the sole basis for any investment decision. The information contained herein is based on publicly available sources believed to be reliable but is not a representation, expressed or implied, as to the accuracy, completeness, or correctness of said information. Past performance does not guarantee future results.
">Powell Power! Those of you who viewed our 2024 Halftime Report will recall that we designated the conflict between the backward-looking FOMC and the forward-looking Jerome Powell as the biggest risk to the economy and the markets. The Fed has two mandates: maintain stable prices and support full employment. Currently, headline inflation measures have downward momentum, while unemployment measures have upward momentum. Based upon the mandate, the Fed should be considering a policy tilt towards accommodation, and yet, at 5.5%, policy sits at highly restrictive levels.The Fed has identified 3% as the neutral policy rate, implying 2.5% of policy restriction just to return to even. While many on the committee prefer a “safer,” more incremental wait-and-see approach to cutting rates, the numbers and the logic argue for a bolder response. It is time for Powell to shed the committee, assert his leadership, and produce. On Wednesday he did just that, inciting the first committee member dissenting vote since 2005.
The Fed cut the overnight interest rate from 5.5% to 5%. A 0.5% cut to begin the cycle amidst committee incrementalism and political scrutiny declares that Powell has the power. Investors initially cheered the move, then reconsidered as a close study of the committee’s projections show a projected three-year timeframe to reach neutral. We agree. But with Powell now leading, rather than following the committee, we suspect a steeper downslope than that.
Why risk recession with inflation whipped?
Powell’s term ends on February 5th, 2026. Few Fed Chairs have achieved a “soft landing” after running a restrictive policy regime. If Powell can forestall recession for the next 17 months, he will secure his legacy as one of them. Powell’s legacy pursuit and leadership assertion provide investors with powerful support. FOMC member Michelle Bowman voted against the 0.50% cut. Powell reacted by stating in the press conference, “There’s nothing wrong with dissents, and if it happens, it happens.” Cue Thursday’s all-time highs.
While we welcome Powell’s rally support, we should not overlook the threat of his opponent. The Fed has now recalibrated efforts from fighting inflation to fighting recession. As investors, we prefer an inflation fight to a recession fight. Historically, stocks perform well in inflationary times. Stocks do not perform well in recessionary times.
Markets may have cheered weak economic data releases during the inflation fight, but they will not cheer weak economic data releases during the recession fight. This invites more anxiety and downward volatility. And while Powell cut the overnight rate 0.5% on Wednesday, the market drove the 10 Year Treasury yield up 0.15%, partially offsetting the stimulus. Recession odds remain low at this point, but risks have risen. A Powell-led soft landing remains our base case, and we have calibrated our investments toward higher earnings and lower rates. For now, markets agree:
Economic growth and lower rates should benefit interest rate-sensitive groups like financials and small caps the most. Economic growth and lower rates should also lower the US dollar and boost international stocks. As seen above, small caps, financials, and internationals have all outperformed the S&P 500 since June 30th. To fund these advances, investors have added cash and proceeds from the previously undefeated Magnificent 7 stocks.
As we watch the macroeconomic data trends vigilantly, we must also scour the macromarket trends for confirmation. As of this writing, the economic and market data agree. Inflation is falling, rates are falling, the economy is growing, and Powell’s legacy pursuit provides powerful recession insurance.
Have a great week!
– David
Sources: Y Charts, https://www.federalreserve.gov/monetarypolicy/files/fomcprojtabl20240918.pdf
This communication and its contents are for informational and educational purposes only and should not be used as the sole basis for any investment decision. The information contained herein is based on publicly available sources believed to be reliable but is not a representation, expressed or implied, as to the accuracy, completeness, or correctness of said information. Past performance does not guarantee future results.
" class="link-chevron">
Periodically, and currently, markets seem disoriented. Soft economic data pairs poorly with small cap outperformance. Higher inflation readings pair poorly with lower rates. US currency strength pairs poorly with US large cap outperformance. When crosscurrents and unusual pairings upend expectations, strategists must re-examine market vitals to identify the root cause of the chaos. Herein lies this week’s assignment.
Economic Growth?
The US economy grew 2.3% in the first half of 2023 driven by solid growth in labor productivity. Currently, the Fed’s GDPNow measure predicts 2.5% growth in the third quarter, up from 2.0% before the stronger-than-reported August jobs report. More forward-looking measures like housing activity and purchasing manager indices suggest a lower final reading, but nothing in the data suggests an imminent recession.

Earnings Growth?
S&P 500 earnings grew 11.3% within the second quarter, with 80% of reporting companies beating analyst expectations. Analysts see a deceleration in earnings growth within the third quarter to 5% but a reacceleration in the 4th quarter to 14%. Expectations for all of 2024 have remained resilient at 10%, while opinions on future earnings have continuously improved, with 15% growth expected in 2025 and 13% expected in 2026.

Inflation?
The August CPI inflation report came in incrementally higher and hotter than expected, but a detailed review reveals little evidence of durable reinflation. Note the trends below. Despite August’s puzzling advance (solely driven by housing, airline, and hotel rates), annualized inflation rates over the last 12 months stand at 3.3%, 6 months at 2.7%, and 3 months at 2.1%. Clearly, these longer-term measures depict an irrefutable disinflationary trend:

Fed Policy?
Chairman Powell made it quite clear that the Fed will cut interest rates next week. The Fed has also published its “neutral” Fed Funds rate of 3%. With the Fed Funds at 5.5% currently, this implies 2.5% of upcoming rate cuts. Fed Funds futures predict that the Fed will cut by .25% next week. We would prefer a .50% cut to kick things off, but recent economic data along with the backward-looking, incremental nature of the FOMC, makes .25% more likely. However, markets do anticipate a full 1% in cuts before the end of the year. With only three meetings remaining that makes one of the cuts a double at .50%. By year end 2025, the market expects the Fed will have completed its rate reduction cycle.

Investor Sentiment?
Investor sentiment levels can often distort market movements as positive economic, earnings, inflation, and interest rate readings fall short of overblown expectations. Given the positive stack of conditions above, lofty sentiment levels might explain lagging returns. However, professional and household investor sentiment levels currently read lukewarm rather than white hot:

The Search Continues
Typically, mixing resilient GDP growth, rising earnings expectations, falling inflation rates, Fed rate cuts, and neutral investor sentiment would send stocks higher. However, since reaching 5,670 on July 17th, stocks have languished and appeared conviction-less. Clearly, something atypical has distracted traders and their algorithms. Perhaps, it’s time we revisit the carry trade. Recall that back in early August, a rapid strengthening of the Japanese Yen resulted in a “flash crash” in the Magnificent 7 and stocks overall. This relationship between an upward thrust in the Yen and a downward thrust in stocks became hardcoded in the market’s algorithms. In response to the August “flash crash”, the Bank of Japan softened their monetary stance which enabled a decline in the Yen and a stock market recovery. However, the Yen quietly resumed its ascent in early September again pressuring stocks in a September “swoon”:

It is this push and pull in the Yen that has directed the push and pull in the market, despite the favorable fundamentals profiled above:

However, as the Yen carry trade unwinds, markets will become less influenced by currency gyrations. Attention will return to more traditional drivers such as resilient GDP growth, rising earnings expectations, falling inflation rates, Fed rate cuts, and neutral investor sentiment. Absent a significant Fed policy mistake, we expect the Yen’s influence will fade, fundamentals will reassert themselves and the rally will resume into year end.
Have a great week!
-David
Sources: Blue Chip Economic Indicators and Blue Chip Financial Forecasts, @Yardeni Research, Bespoke, Creative Planning, LSEG Datastream, Y Charts
This communication and its contents are for informational and educational purposes only and should not be used as the sole basis for any investment decision. The information contained herein is based on publicly available sources believed to be reliable but is not a representation, expressed or implied, as to the accuracy, completeness, or correctness of said information. Past performance does not guarantee future results.
">What’s Sequestering Stocks?
Periodically, and currently, markets seem disoriented. Soft economic data pairs poorly with small cap outperformance. Higher inflation readings pair poorly with lower rates. US currency strength pairs poorly with US large cap outperformance. When crosscurrents and unusual pairings upend expectations, strategists must re-examine market vitals to identify the root cause of the chaos. Herein lies this week’s assignment.
Economic Growth?
The US economy grew 2.3% in the first half of 2023 driven by solid growth in labor productivity. Currently, the Fed’s GDPNow measure predicts 2.5% growth in the third quarter, up from 2.0% before the stronger-than-reported August jobs report. More forward-looking measures like housing activity and purchasing manager indices suggest a lower final reading, but nothing in the data suggests an imminent recession.
Earnings Growth?
S&P 500 earnings grew 11.3% within the second quarter, with 80% of reporting companies beating analyst expectations. Analysts see a deceleration in earnings growth within the third quarter to 5% but a reacceleration in the 4th quarter to 14%. Expectations for all of 2024 have remained resilient at 10%, while opinions on future earnings have continuously improved, with 15% growth expected in 2025 and 13% expected in 2026.
Inflation?
The August CPI inflation report came in incrementally higher and hotter than expected, but a detailed review reveals little evidence of durable reinflation. Note the trends below. Despite August’s puzzling advance (solely driven by housing, airline, and hotel rates), annualized inflation rates over the last 12 months stand at 3.3%, 6 months at 2.7%, and 3 months at 2.1%. Clearly, these longer-term measures depict an irrefutable disinflationary trend:
Fed Policy?
Chairman Powell made it quite clear that the Fed will cut interest rates next week. The Fed has also published its “neutral” Fed Funds rate of 3%. With the Fed Funds at 5.5% currently, this implies 2.5% of upcoming rate cuts. Fed Funds futures predict that the Fed will cut by .25% next week. We would prefer a .50% cut to kick things off, but recent economic data along with the backward-looking, incremental nature of the FOMC, makes .25% more likely. However, markets do anticipate a full 1% in cuts before the end of the year. With only three meetings remaining that makes one of the cuts a double at .50%. By year end 2025, the market expects the Fed will have completed its rate reduction cycle.
Investor Sentiment?
Investor sentiment levels can often distort market movements as positive economic, earnings, inflation, and interest rate readings fall short of overblown expectations. Given the positive stack of conditions above, lofty sentiment levels might explain lagging returns. However, professional and household investor sentiment levels currently read lukewarm rather than white hot:
The Search Continues
Typically, mixing resilient GDP growth, rising earnings expectations, falling inflation rates, Fed rate cuts, and neutral investor sentiment would send stocks higher. However, since reaching 5,670 on July 17th, stocks have languished and appeared conviction-less. Clearly, something atypical has distracted traders and their algorithms. Perhaps, it’s time we revisit the carry trade. Recall that back in early August, a rapid strengthening of the Japanese Yen resulted in a “flash crash” in the Magnificent 7 and stocks overall. This relationship between an upward thrust in the Yen and a downward thrust in stocks became hardcoded in the market’s algorithms. In response to the August “flash crash”, the Bank of Japan softened their monetary stance which enabled a decline in the Yen and a stock market recovery. However, the Yen quietly resumed its ascent in early September again pressuring stocks in a September “swoon”:
It is this push and pull in the Yen that has directed the push and pull in the market, despite the favorable fundamentals profiled above:
However, as the Yen carry trade unwinds, markets will become less influenced by currency gyrations. Attention will return to more traditional drivers such as resilient GDP growth, rising earnings expectations, falling inflation rates, Fed rate cuts, and neutral investor sentiment. Absent a significant Fed policy mistake, we expect the Yen’s influence will fade, fundamentals will reassert themselves and the rally will resume into year end.
Have a great week!
-David
Sources: Blue Chip Economic Indicators and Blue Chip Financial Forecasts, @Yardeni Research, Bespoke, Creative Planning, LSEG Datastream, Y Charts
This communication and its contents are for informational and educational purposes only and should not be used as the sole basis for any investment decision. The information contained herein is based on publicly available sources believed to be reliable but is not a representation, expressed or implied, as to the accuracy, completeness, or correctness of said information. Past performance does not guarantee future results.
" class="link-chevron">
For those who watched our 2024 halftime report, you will recall our concern that the greatest risk for investors resided within the tension between the backward-looking Federal Open Market Committee and its forward-looking Chairman, Jerome Powell. While Powell seemed to defer to the committee and its inertia over the past few months, he broke away on Friday with conviction. Here are some of his comments made at Jackson Hole that had me dancing at my desk:
“Our restrictive monetary policy helped restore balance between aggregate supply and demand…”
Translation: The economy has normalized. Monetary policy should normalize.
“My confidence has grown that inflation is on a sustainable path back to 2 percent.”
Translation: I’m in charge now. I will cut rates.
“All told, labor market conditions are now less tight than just before the pandemic in 2019—a year when inflation ran below 2 percent…”
Translation: In 2019, the Fed Funds rate averaged 2.16% in a tighter labor market with no inflation. I have substantial room to cut rates.
Markets responded quickly to Powell’s remarks as the probability of a .50% rate cut in September rose, indicating a more dovish statement than anticipated. The U.S. Dollar weakened, longer term interest rates dropped, and small cap stocks surged. Powell has formally pivoted. Investors must now formally pivot as well.
I recently discussed with Frank Holland at CNBC that the market has been vacillating between three primary trading strategies recently. The first strategy is the “Magnificent 7 trade” supported by status quo conditions of stable economic growth and limited earnings breadth (Mag 7s win). The second strategy is the “rotation trade” supported by disinflation, rate cuts, and earnings dispersion beyond the Magnificent 7 (small caps win). The third is the “recession trade” supported by restrictive monetary policy inertia and employment report undershoots (everything loses). To determine which trade holds advantage, let’s review the contest between small caps and the Magnificent 7 since 6/30:

Over the last two months, markets have appeared indecisive as all three strategies have held leadership positions. First, the Magnificent 7 trade continued its first-half leadership into the early second half. Next, the rotation trade surged dramatically on a weak inflation report. Then, confusion over a weak employment report and the busted Yen carry trade led to a temporary ascension for the recession trade. Next, a return of economic confidence revived the Magnificent 7 trade. Finally, the Powell pivot reignited the rotation trade. For the entire period, the “rotation trade” has the lead as Small Caps outperformed the Magnificent 7 group by 6%. We expect this will continue since history favors small cap stocks during Fed rate cut cycles:

Clearly, rate cuts power small cap outperformance, but small cap rallies haven’t been trustworthy in years. This has left them unloved and under-owned, only adding even more rally capacity to them. Much of this neglect has been a function of the “potential” for rate cuts, rather than the promise of rate cuts, or rate cuts themselves. But with Powell’s newfound rate cut conviction, investors must gain conviction in the “Rotation Trade” to best play… the Powell payday!
Have a great week!
-David
Sources: YCharts, Jeffries, Federal reserve Board. Haver Analytics Center for Research in Securities Prices, University of Chicago Booth School of Business
This communication and its contents are for informational and educational purposes only and should not be used as the sole basis for any investment decision. The information contained herein is based on publicly available sources believed to be reliable but is not a representation, expressed or implied, as to the accuracy, completeness, or correctness of said information. Past performance does not guarantee future results.
">The Powell Payday!
For those who watched our 2024 halftime report, you will recall our concern that the greatest risk for investors resided within the tension between the backward-looking Federal Open Market Committee and its forward-looking Chairman, Jerome Powell. While Powell seemed to defer to the committee and its inertia over the past few months, he broke away on Friday with conviction. Here are some of his comments made at Jackson Hole that had me dancing at my desk:
“Our restrictive monetary policy helped restore balance between aggregate supply and demand…”
Translation: The economy has normalized. Monetary policy should normalize.
“My confidence has grown that inflation is on a sustainable path back to 2 percent.”
Translation: I’m in charge now. I will cut rates.
“All told, labor market conditions are now less tight than just before the pandemic in 2019—a year when inflation ran below 2 percent…”
Translation: In 2019, the Fed Funds rate averaged 2.16% in a tighter labor market with no inflation. I have substantial room to cut rates.
Markets responded quickly to Powell’s remarks as the probability of a .50% rate cut in September rose, indicating a more dovish statement than anticipated. The U.S. Dollar weakened, longer term interest rates dropped, and small cap stocks surged. Powell has formally pivoted. Investors must now formally pivot as well.
I recently discussed with Frank Holland at CNBC that the market has been vacillating between three primary trading strategies recently. The first strategy is the “Magnificent 7 trade” supported by status quo conditions of stable economic growth and limited earnings breadth (Mag 7s win). The second strategy is the “rotation trade” supported by disinflation, rate cuts, and earnings dispersion beyond the Magnificent 7 (small caps win). The third is the “recession trade” supported by restrictive monetary policy inertia and employment report undershoots (everything loses). To determine which trade holds advantage, let’s review the contest between small caps and the Magnificent 7 since 6/30:
Over the last two months, markets have appeared indecisive as all three strategies have held leadership positions. First, the Magnificent 7 trade continued its first-half leadership into the early second half. Next, the rotation trade surged dramatically on a weak inflation report. Then, confusion over a weak employment report and the busted Yen carry trade led to a temporary ascension for the recession trade. Next, a return of economic confidence revived the Magnificent 7 trade. Finally, the Powell pivot reignited the rotation trade. For the entire period, the “rotation trade” has the lead as Small Caps outperformed the Magnificent 7 group by 6%. We expect this will continue since history favors small cap stocks during Fed rate cut cycles:
Clearly, rate cuts power small cap outperformance, but small cap rallies haven’t been trustworthy in years. This has left them unloved and under-owned, only adding even more rally capacity to them. Much of this neglect has been a function of the “potential” for rate cuts, rather than the promise of rate cuts, or rate cuts themselves. But with Powell’s newfound rate cut conviction, investors must gain conviction in the “Rotation Trade” to best play… the Powell payday!
Have a great week!
-David
Sources: YCharts, Jeffries, Federal reserve Board. Haver Analytics Center for Research in Securities Prices, University of Chicago Booth School of Business
This communication and its contents are for informational and educational purposes only and should not be used as the sole basis for any investment decision. The information contained herein is based on publicly available sources believed to be reliable but is not a representation, expressed or implied, as to the accuracy, completeness, or correctness of said information. Past performance does not guarantee future results.
" class="link-chevron">
The Full Story:
This week produced a deluge of earnings reports, Fed policy decisions, and economic reports. Each held stand-alone information that told investors one thing, while their combined information told investors another. This dissonance created anxiety in the marketplace, culminating in a sharp sell-off to begin August. Let’s pick through the headlines and low lines to ascertain if this is cataclysmic or simply a storm before the calm.
Second quarter earnings reports have proven supportive for the markets overall, with 80% of those reporting beating expectations. However, notable exceptions weighed heavily on sentiment. Among the Magnificent 7, six have now reported earnings. Here is how they have fared since reporting:

Tesla bombed with numbers far short of expectations. Alphabet whiffed with disappointing ad growth from YouTube. Amazon revenue growth and guidance disappointed. Microsoft fell short of growth expectations for its cloud services. Each fell notably. Apple fanned hopes that AI integration will soon boost lagging iPhone sales. Meta reported solid earnings and raised forward guidance as AI has boosted ad sales. Each rose marginally. So, of the Mag 6 that have reported, only Meta proved its magnificence.
But is this true?
Even including Tesla’s troubles, the Mag 6 reported average earnings growth of 30% over the past year despite colossal capital expenditures. In reality, these earnings are magnificent. Unfortunately, expectations were higher. Pricing these stocks for perfection set the stage for a sell-off, just as pricing small-cap stocks for death set the stage for a surge. Sentiment extremes invite rotations. Don’t confuse investor rotation with fundamental failure. The added lift from the reporting Mag 7 has pushed S&P 500 expected earnings growth well over 10% for this quarter… a level that may persist for many quarters to come.
What the Fed Shoulda Said
The Federal Reserve concluded its July meeting by releasing an official statement shifting focus slightly away from inflation concerns and slightly toward unemployment concerns, bringing the two concerns roughly into balance. The Fed noted that a rate cut in September “seems appropriate.” An off-cycle cut in July might have appeared panicky, but by passing in June and waiting until September, the Fed may have fallen behind the curve. If they view the balance between inflation and employment risks as neutral, then why leave the Fed funds rate in such restrictive territory? The Fed has held rates at 5.5% for 12 months now while broadcasting that the neutral rate sits near 3%. Maintaining a 2.5% restrictive rate spread between today’s “normal” economics and the “neutral” policy rate seems like a mistake to us. Jerome Powell will surely outline his “soft landing” plan for insurance interest rate cuts at Jackson Hole at the end of this month. However, should “hard landing” risks percolate, appropriate policy will need to quickly shift from insurance cuts (slow and shallow) to emergency cuts (fast and deep). No denial accommodations afforded to backward-looking FOMC members who prefer inertia, please. Powell needs the courage to speak and act decisively.
Insurance or Emergency?
The COVID economy followed a clear progression. First, fear and quarantines forced a fast recession. Next, stimulus and stay-at-home requirements ignited a surge in goods demand and goods inflation. Then, as quarantines lifted and cabin fever roared, the splurge on services led to labor shortages and wage inflation. To combat roaring inflation, the Fed hiked rates aggressively and inverted the yield curve. This led to major bank failures in early 2023, contained only by major response measures from the Treasury and the Fed. In the latter part of 2023, the strength of the “Swifty” economy offset the undertow from goods and housing weakness. 2024 provides “soft landing” potential as COVID aftershocks pass, restoring normalized growth, inflation, and Fed policy. Close curtain!
Unfortunately, economics isn’t so neatly predictable. Acute data hawks took nervous note of the June ISM services report, depicting a service economy (78% of GDP) in surprise contraction.

Without an uplift from the services side of the economy, the undertow of housing and manufacturing threatens overall economic buoyancy. For our readers, you will remember our call for rate cuts intensified around this time. With the goods and services sides of the economy indicating weakness, a weak labor report should logically follow… and we received that report on Friday.
The US economy added 114,000 jobs in July, far less than the 185,000 jobs expected. The unemployment rate rose to 4.3%, its highest level since October of 2021 and nearly a full percentage higher than the 3.4% low reached in 2023. Historically, upticks of this magnitude in the unemployment rate have presaged recession, as seen below:

Following the report, futures markets priced in a greater than 70% chance that the Fed will cut interest rates by .50% in September. While this may appear like an emergency cut (faster and deeper), we see it more as a catch-up insurance cut (slower and shallower), but the message in the markets is clear: the “long and variable lags” have arrived and without rate normalization, a recession will follow.
In sum, by not cutting rates starting in June, the Fed has fallen behind the curve. Friday’s labor report confirms the mistake but provides the opportunity for correction, first with decisive language from Powell’s Jackson Hole speech and then with decisive action at the September FOMC meeting. Investors should use this summer swoon to relocate money market funds with falling yields into longer-term bonds with rising prices and corporate equities with rising earnings.
Enjoy your weekend!
-David
Sources: FRED, YCharts, Yahoo Finance
This communication and its contents are for informational and educational purposes only and should not be used as the sole basis for any investment decision. The information contained herein is based on publicly available sources believed to be reliable but is not a representation, expressed or implied, as to the accuracy, completeness, or correctness of said information. Past performance does not guarantee future results.
">The Storm Before the Calm The Full Story:This week produced a deluge of earnings reports, Fed policy decisions, and economic reports. Each held stand-alone information that told investors one thing, while their combined information told investors another. This dissonance created anxiety in the marketplace, culminating in a sharp sell-off to begin August. Let’s pick through the headlines and low lines to ascertain if this is cataclysmic or simply a storm before the calm.
Second quarter earnings reports have proven supportive for the markets overall, with 80% of those reporting beating expectations. However, notable exceptions weighed heavily on sentiment. Among the Magnificent 7, six have now reported earnings. Here is how they have fared since reporting:
Tesla bombed with numbers far short of expectations. Alphabet whiffed with disappointing ad growth from YouTube. Amazon revenue growth and guidance disappointed. Microsoft fell short of growth expectations for its cloud services. Each fell notably. Apple fanned hopes that AI integration will soon boost lagging iPhone sales. Meta reported solid earnings and raised forward guidance as AI has boosted ad sales. Each rose marginally. So, of the Mag 6 that have reported, only Meta proved its magnificence.
But is this true?
Even including Tesla’s troubles, the Mag 6 reported average earnings growth of 30% over the past year despite colossal capital expenditures. In reality, these earnings are magnificent. Unfortunately, expectations were higher. Pricing these stocks for perfection set the stage for a sell-off, just as pricing small-cap stocks for death set the stage for a surge. Sentiment extremes invite rotations. Don’t confuse investor rotation with fundamental failure. The added lift from the reporting Mag 7 has pushed S&P 500 expected earnings growth well over 10% for this quarter… a level that may persist for many quarters to come.
What the Fed Shoulda Said
The Federal Reserve concluded its July meeting by releasing an official statement shifting focus slightly away from inflation concerns and slightly toward unemployment concerns, bringing the two concerns roughly into balance. The Fed noted that a rate cut in September “seems appropriate.” An off-cycle cut in July might have appeared panicky, but by passing in June and waiting until September, the Fed may have fallen behind the curve. If they view the balance between inflation and employment risks as neutral, then why leave the Fed funds rate in such restrictive territory? The Fed has held rates at 5.5% for 12 months now while broadcasting that the neutral rate sits near 3%. Maintaining a 2.5% restrictive rate spread between today’s “normal” economics and the “neutral” policy rate seems like a mistake to us. Jerome Powell will surely outline his “soft landing” plan for insurance interest rate cuts at Jackson Hole at the end of this month. However, should “hard landing” risks percolate, appropriate policy will need to quickly shift from insurance cuts (slow and shallow) to emergency cuts (fast and deep). No denial accommodations afforded to backward-looking FOMC members who prefer inertia, please. Powell needs the courage to speak and act decisively.
Insurance or Emergency?
The COVID economy followed a clear progression. First, fear and quarantines forced a fast recession. Next, stimulus and stay-at-home requirements ignited a surge in goods demand and goods inflation. Then, as quarantines lifted and cabin fever roared, the splurge on services led to labor shortages and wage inflation. To combat roaring inflation, the Fed hiked rates aggressively and inverted the yield curve. This led to major bank failures in early 2023, contained only by major response measures from the Treasury and the Fed. In the latter part of 2023, the strength of the “Swifty” economy offset the undertow from goods and housing weakness. 2024 provides “soft landing” potential as COVID aftershocks pass, restoring normalized growth, inflation, and Fed policy. Close curtain!
Unfortunately, economics isn’t so neatly predictable. Acute data hawks took nervous note of the June ISM services report, depicting a service economy (78% of GDP) in surprise contraction.
Without an uplift from the services side of the economy, the undertow of housing and manufacturing threatens overall economic buoyancy. For our readers, you will remember our call for rate cuts intensified around this time. With the goods and services sides of the economy indicating weakness, a weak labor report should logically follow… and we received that report on Friday.
The US economy added 114,000 jobs in July, far less than the 185,000 jobs expected. The unemployment rate rose to 4.3%, its highest level since October of 2021 and nearly a full percentage higher than the 3.4% low reached in 2023. Historically, upticks of this magnitude in the unemployment rate have presaged recession, as seen below:
Following the report, futures markets priced in a greater than 70% chance that the Fed will cut interest rates by .50% in September. While this may appear like an emergency cut (faster and deeper), we see it more as a catch-up insurance cut (slower and shallower), but the message in the markets is clear: the “long and variable lags” have arrived and without rate normalization, a recession will follow.
In sum, by not cutting rates starting in June, the Fed has fallen behind the curve. Friday’s labor report confirms the mistake but provides the opportunity for correction, first with decisive language from Powell’s Jackson Hole speech and then with decisive action at the September FOMC meeting. Investors should use this summer swoon to relocate money market funds with falling yields into longer-term bonds with rising prices and corporate equities with rising earnings.
Enjoy your weekend!
-David
Sources: FRED, YCharts, Yahoo Finance
This communication and its contents are for informational and educational purposes only and should not be used as the sole basis for any investment decision. The information contained herein is based on publicly available sources believed to be reliable but is not a representation, expressed or implied, as to the accuracy, completeness, or correctness of said information. Past performance does not guarantee future results.
" class="link-chevron">The most important thing when forecasting markets is to know what the most important thing is. Over the past few years, the most important thing has migrated from COVID cases to stimulus programs to inflation reports to geopolitical skirmishes to rate expectations. Strategists today must decide whether to focus on election risks, rate risks, or earnings risks after such a robust run. Let’s take a look at each to decide what’s most important now.
Election Inspection
With bullets bouncing off Trump and Democrats in disarray, the Trump odds look bankable. According to futures markets, Trump has a 65% chance of winning the White House compared with 27% for Kamala and 13% for Biden:

Source: https://www.predictit.org/markets/detail/7456/Who-will-win-the-2024-US-presidential-election
Regardless of your political preference, not having a clear candidate going into the homestretch doesn’t bode well for Democrats. Anything can happen, but at this point, markets have inaugurated Donald Trump. While this level of certainty creates vulnerabilities, markets have accepted this election fate, shifting anxieties elsewhere.
Interest Rate Fate
June’s soft Consumer Price Index report, paired with softening employment data, has markets pricing in near certain odds for a September rate cut:

We concur and believe Powell would happily cut them at the July meeting, but markets price in only a 5% chance of that. The Fed prefers to time policy moves with FOMC calendared press conferences and doesn’t want to appear concerned. After they cut in September, markets expect cuts to continue, currently pricing in 5 over the next twelve months. Whether they cut rates more or less isn’t material, what’s material is that cuts will soon occur. While this level of certainty creates vulnerabilities, markets have accepted this rate fate for now, shifting anxieties elsewhere.
Concerning Earnings
Rarely have analysts ever been as optimistic about forward earnings as they are today. Analysts see S&P 500 earnings rising 9% this year, 14% next year, and 11% the following year:

The S&P 500 currently trades at a forward P/E of 21.2x. Should that valuation persist, mathematically, the S&P 500 should close 2024 at 5936 and 2025 at 6572, 8% and 11% higher, respectively (based upon Friday’s 5505 close). Unfortunately, analyst’s earnings enthusiasm at this level hasn’t historically held. Focus on the LTEG blue line in the following chart, which represents the 5 year forward annualized earnings growth rate expected for the S&P 500:

The last few times analysts have projected 5-year growth rates anywhere near 20%, markets have fallen and pulled estimates lower. Should these earnings growth rates materialize, this market will climb much, much higher. Should they dematerialize, this market will lack further rally fuel, and valuations will lack justification. Earnings have become the market’s greatest vulnerability, making earnings season the most important thing.
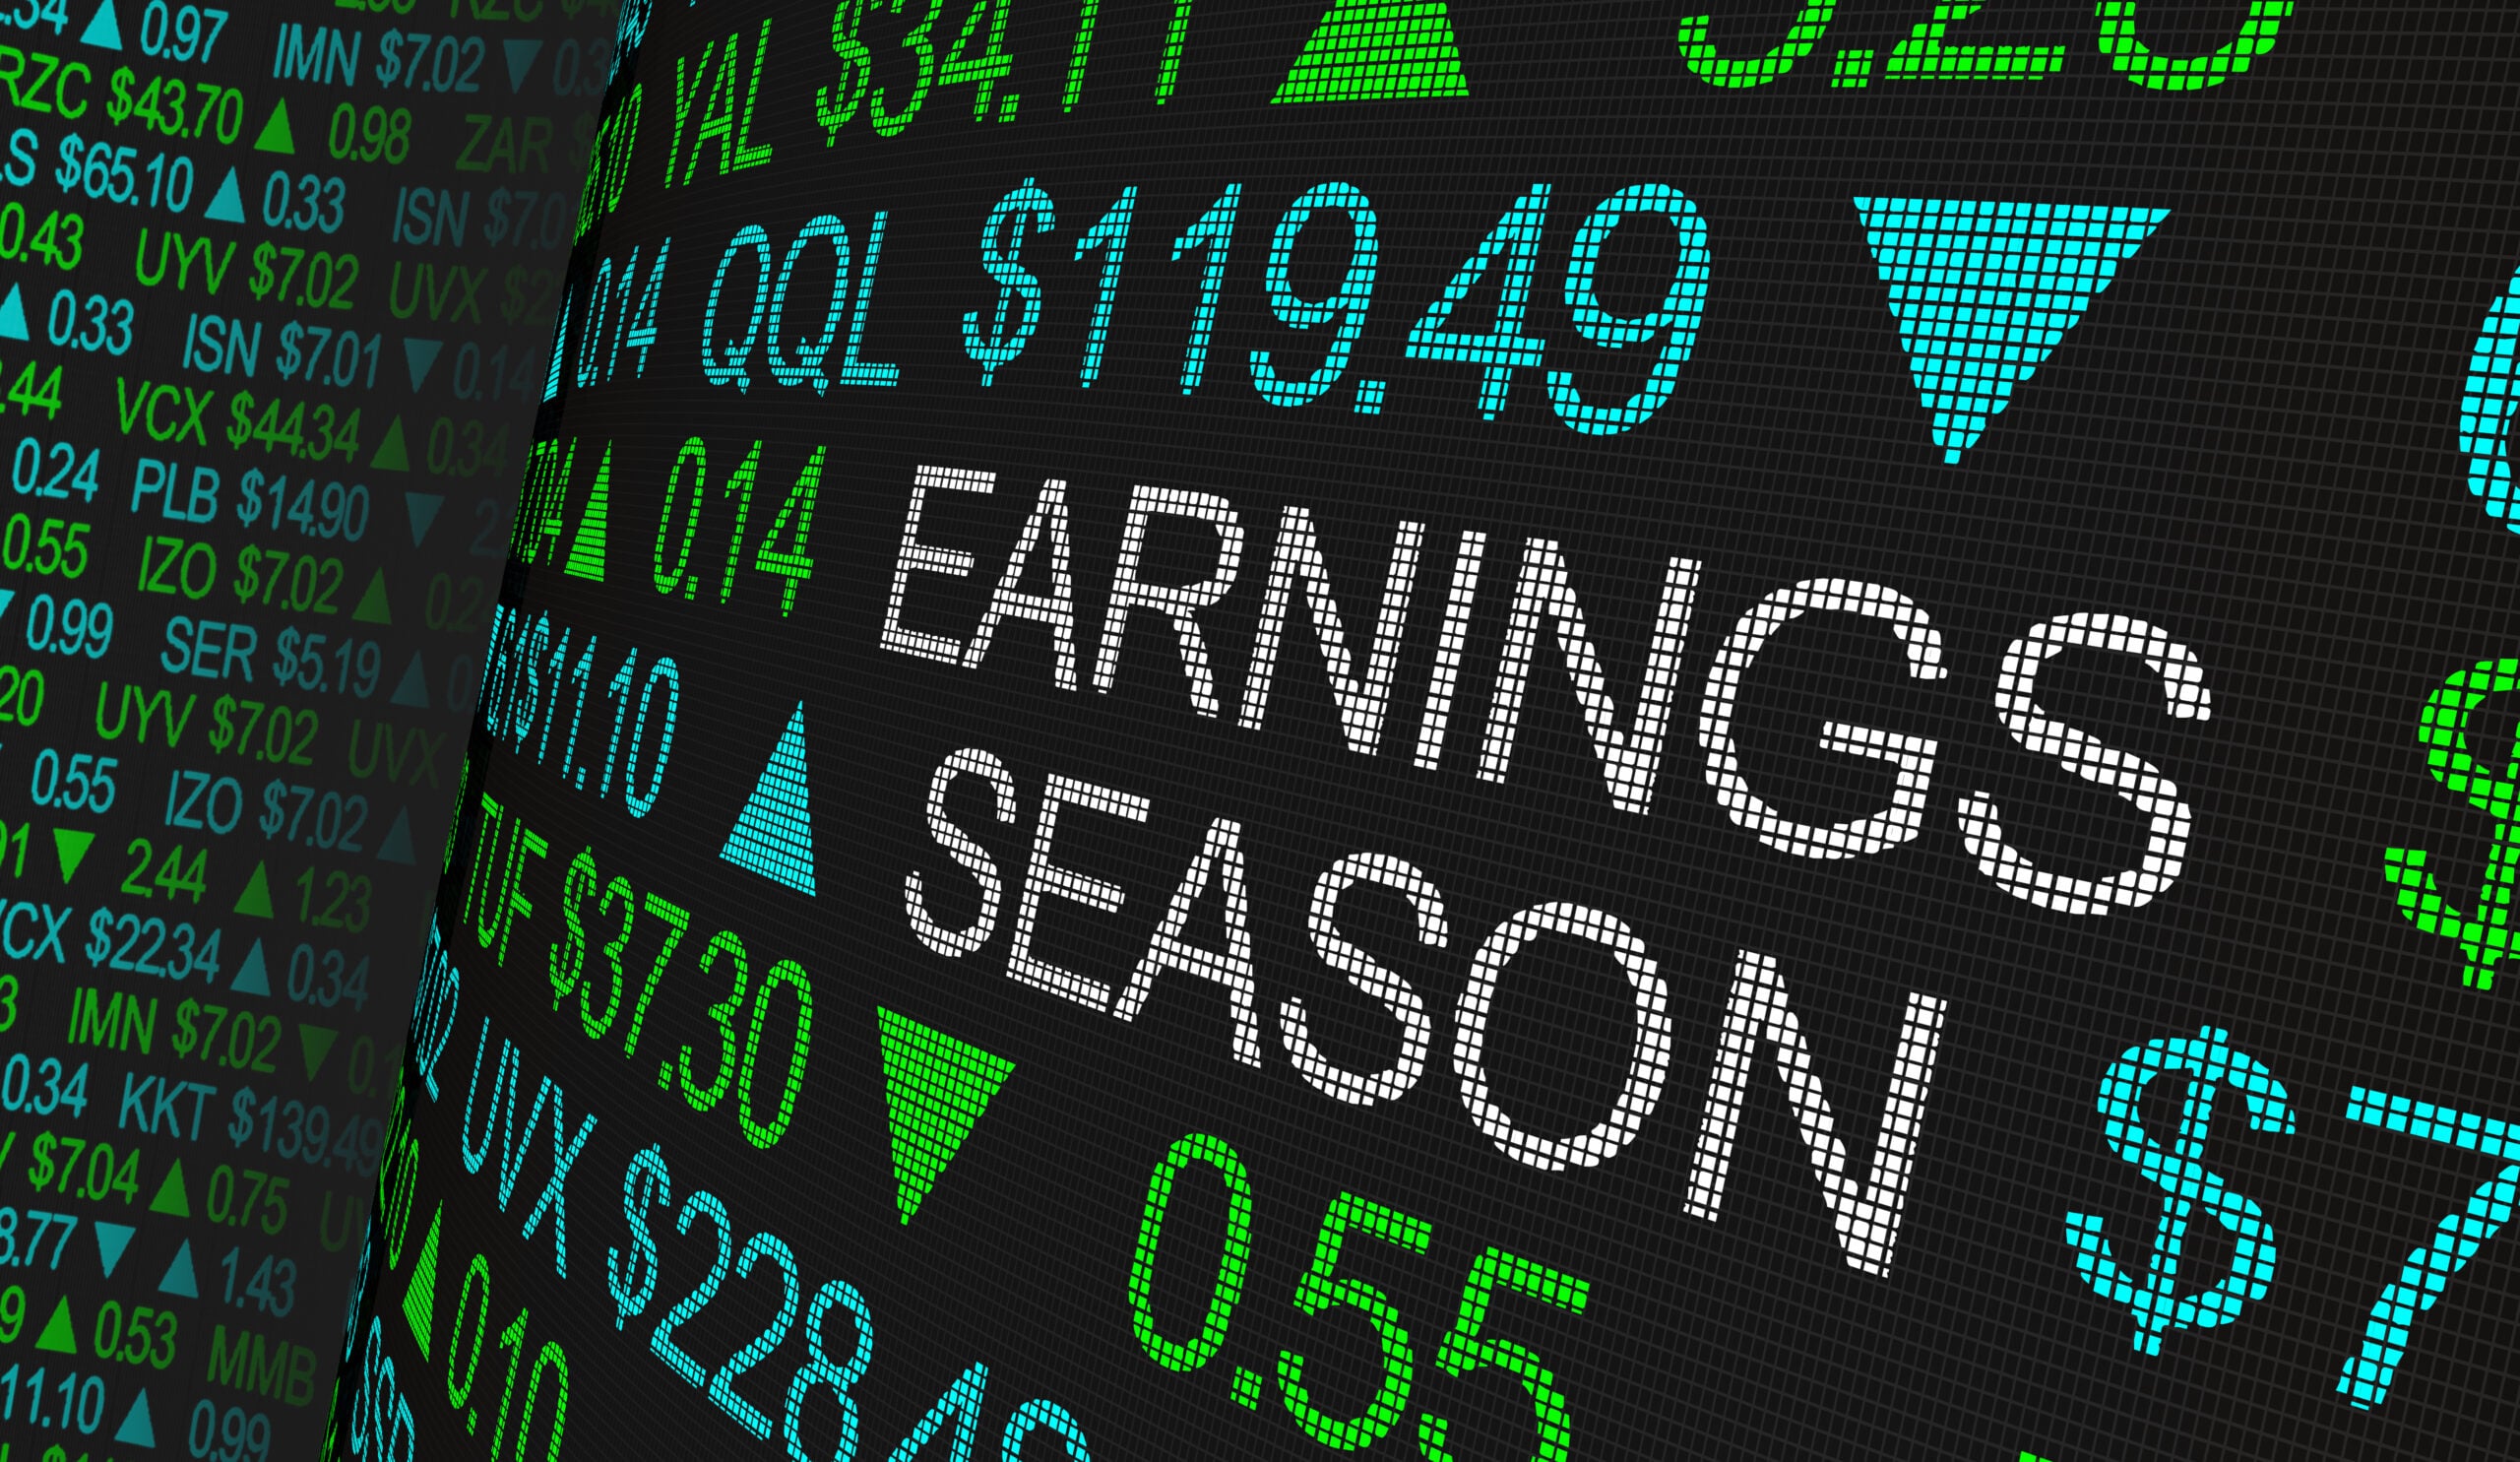
Let the Season Begin
About 15% of the S&P 500 companies have reported so far, with 83% of reporting companies beating expectations. This exceeds the long-term average of earnings beats, providing healthy foreshadowing. However, most earnings releases arrive over the next two weeks, and expectations have recently receded. Note that the conviction in 2024’s earnings growth rate has waned of late, somewhat offset by rising expectations for growth rates in 2025 and 2026.

This tension requires attention and will receive plenty over the next two weeks as 300 S&P 500 companies report. While Jerome Powell may no longer be “data dependent” to justify rate cuts, this rally has become heavily “earnings dependent” to justify further gains. While we remain optimistic, the risks seem asymmetric. Should earnings meet or beat expectations, markets can hold these levels. Should earnings miss, markets could correct. On average, the S&P 500 contracts 14% during election years. To date, we have only seen a 5.5% correction. Perhaps we are due. If so, however, fear not! On average, markets have also rallied 24% within the year following those election year lows, making that truly… the most important thing!
Have a great week!
-David
Sources: Predictit.org, Bloomberg Finance, L.P., LSEG Datastream and Yardeni Research
This communication and its contents are for informational and educational purposes only and should not be used as the sole basis for any investment decision. The information contained herein is based on publicly available sources believed to be reliable but is not a representation, expressed or implied, as to the accuracy, completeness, or correctness of said information. Past performance does not guarantee future results.
">
The Full Story:
The most important thing when forecasting markets is to know what the most important thing is. Over the past few years, the most important thing has migrated from COVID cases to stimulus programs to inflation reports to geopolitical skirmishes to rate expectations. Strategists today must decide whether to focus on election risks, rate risks, or earnings risks after such a robust run. Let’s take a look at each to decide what’s most important now.
Election Inspection
With bullets bouncing off Trump and Democrats in disarray, the Trump odds look bankable. According to futures markets, Trump has a 65% chance of winning the White House compared with 27% for Kamala and 13% for Biden:
Source: https://www.predictit.org/markets/detail/7456/Who-will-win-the-2024-US-presidential-election
Regardless of your political preference, not having a clear candidate going into the homestretch doesn’t bode well for Democrats. Anything can happen, but at this point, markets have inaugurated Donald Trump. While this level of certainty creates vulnerabilities, markets have accepted this election fate, shifting anxieties elsewhere.
Interest Rate Fate
June’s soft Consumer Price Index report, paired with softening employment data, has markets pricing in near certain odds for a September rate cut:
We concur and believe Powell would happily cut them at the July meeting, but markets price in only a 5% chance of that. The Fed prefers to time policy moves with FOMC calendared press conferences and doesn’t want to appear concerned. After they cut in September, markets expect cuts to continue, currently pricing in 5 over the next twelve months. Whether they cut rates more or less isn’t material, what’s material is that cuts will soon occur. While this level of certainty creates vulnerabilities, markets have accepted this rate fate for now, shifting anxieties elsewhere.
Concerning Earnings
Rarely have analysts ever been as optimistic about forward earnings as they are today. Analysts see S&P 500 earnings rising 9% this year, 14% next year, and 11% the following year:
The S&P 500 currently trades at a forward P/E of 21.2x. Should that valuation persist, mathematically, the S&P 500 should close 2024 at 5936 and 2025 at 6572, 8% and 11% higher, respectively (based upon Friday’s 5505 close). Unfortunately, analyst’s earnings enthusiasm at this level hasn’t historically held. Focus on the LTEG blue line in the following chart, which represents the 5 year forward annualized earnings growth rate expected for the S&P 500:
The last few times analysts have projected 5-year growth rates anywhere near 20%, markets have fallen and pulled estimates lower. Should these earnings growth rates materialize, this market will climb much, much higher. Should they dematerialize, this market will lack further rally fuel, and valuations will lack justification. Earnings have become the market’s greatest vulnerability, making earnings season the most important thing.
Let the Season Begin
About 15% of the S&P 500 companies have reported so far, with 83% of reporting companies beating expectations. This exceeds the long-term average of earnings beats, providing healthy foreshadowing. However, most earnings releases arrive over the next two weeks, and expectations have recently receded. Note that the conviction in 2024’s earnings growth rate has waned of late, somewhat offset by rising expectations for growth rates in 2025 and 2026.
This tension requires attention and will receive plenty over the next two weeks as 300 S&P 500 companies report. While Jerome Powell may no longer be “data dependent” to justify rate cuts, this rally has become heavily “earnings dependent” to justify further gains. While we remain optimistic, the risks seem asymmetric. Should earnings meet or beat expectations, markets can hold these levels. Should earnings miss, markets could correct. On average, the S&P 500 contracts 14% during election years. To date, we have only seen a 5.5% correction. Perhaps we are due. If so, however, fear not! On average, markets have also rallied 24% within the year following those election year lows, making that truly… the most important thing!
Have a great week!
-David
Sources: Predictit.org, Bloomberg Finance, L.P., LSEG Datastream and Yardeni Research
This communication and its contents are for informational and educational purposes only and should not be used as the sole basis for any investment decision. The information contained herein is based on publicly available sources believed to be reliable but is not a representation, expressed or implied, as to the accuracy, completeness, or correctness of said information. Past performance does not guarantee future results.
">The Most Important Thing The Full Story:The most important thing when forecasting markets is to know what the most important thing is. Over the past few years, the most important thing has migrated from COVID cases to stimulus programs to inflation reports to geopolitical skirmishes to rate expectations. Strategists today must decide whether to focus on election risks, rate risks, or earnings risks after such a robust run. Let’s take a look at each to decide what’s most important now.
Election Inspection
With bullets bouncing off Trump and Democrats in disarray, the Trump odds look bankable. According to futures markets, Trump has a 65% chance of winning the White House compared with 27% for Kamala and 13% for Biden:
Source: https://www.predictit.org/markets/detail/7456/Who-will-win-the-2024-US-presidential-election
Regardless of your political preference, not having a clear candidate going into the homestretch doesn’t bode well for Democrats. Anything can happen, but at this point, markets have inaugurated Donald Trump. While this level of certainty creates vulnerabilities, markets have accepted this election fate, shifting anxieties elsewhere.
Interest Rate Fate
June’s soft Consumer Price Index report, paired with softening employment data, has markets pricing in near certain odds for a September rate cut:
We concur and believe Powell would happily cut them at the July meeting, but markets price in only a 5% chance of that. The Fed prefers to time policy moves with FOMC calendared press conferences and doesn’t want to appear concerned. After they cut in September, markets expect cuts to continue, currently pricing in 5 over the next twelve months. Whether they cut rates more or less isn’t material, what’s material is that cuts will soon occur. While this level of certainty creates vulnerabilities, markets have accepted this rate fate for now, shifting anxieties elsewhere.
Concerning Earnings
Rarely have analysts ever been as optimistic about forward earnings as they are today. Analysts see S&P 500 earnings rising 9% this year, 14% next year, and 11% the following year:
The S&P 500 currently trades at a forward P/E of 21.2x. Should that valuation persist, mathematically, the S&P 500 should close 2024 at 5936 and 2025 at 6572, 8% and 11% higher, respectively (based upon Friday’s 5505 close). Unfortunately, analyst’s earnings enthusiasm at this level hasn’t historically held. Focus on the LTEG blue line in the following chart, which represents the 5 year forward annualized earnings growth rate expected for the S&P 500:
The last few times analysts have projected 5-year growth rates anywhere near 20%, markets have fallen and pulled estimates lower. Should these earnings growth rates materialize, this market will climb much, much higher. Should they dematerialize, this market will lack further rally fuel, and valuations will lack justification. Earnings have become the market’s greatest vulnerability, making earnings season the most important thing.
Let the Season Begin
About 15% of the S&P 500 companies have reported so far, with 83% of reporting companies beating expectations. This exceeds the long-term average of earnings beats, providing healthy foreshadowing. However, most earnings releases arrive over the next two weeks, and expectations have recently receded. Note that the conviction in 2024’s earnings growth rate has waned of late, somewhat offset by rising expectations for growth rates in 2025 and 2026.
This tension requires attention and will receive plenty over the next two weeks as 300 S&P 500 companies report. While Jerome Powell may no longer be “data dependent” to justify rate cuts, this rally has become heavily “earnings dependent” to justify further gains. While we remain optimistic, the risks seem asymmetric. Should earnings meet or beat expectations, markets can hold these levels. Should earnings miss, markets could correct. On average, the S&P 500 contracts 14% during election years. To date, we have only seen a 5.5% correction. Perhaps we are due. If so, however, fear not! On average, markets have also rallied 24% within the year following those election year lows, making that truly… the most important thing!
Have a great week!
-David
Sources: Predictit.org, Bloomberg Finance, L.P., LSEG Datastream and Yardeni Research
This communication and its contents are for informational and educational purposes only and should not be used as the sole basis for any investment decision. The information contained herein is based on publicly available sources believed to be reliable but is not a representation, expressed or implied, as to the accuracy, completeness, or correctness of said information. Past performance does not guarantee future results.
" class="link-chevron">
The Full Story:
Federal Reserve Chief Jerome Powell is not an economist. Jerome studied politics at Princeton and obtained a law degree from Georgetown. He worked as an investment banker for Dillon, Read & Co., in capital markets at the US Treasury, led corporate finance at Bankers Trust, and identified, developed, and divested industrial businesses within private equity mega-firm, The Carlyle Group. Of the 12 voting members of the FOMC, eight have a Ph.D in economics. Other than Jerome Powell, the three who do not hold a Ph.D. in economics include a regulator and community banker (Michelle Bowman), a public policy professor (Michael Barr), and a consultant (Thomas Barkin). Only Jay Powell has a background in operating within capital markets, making go/no-go investment decisions, and structuring finance packages based on projections.
We made note of Powell’s visible discomfort at the last FOMC press conference on June 12th. The Committee opted to leave rates unchanged and reduced their rate cut projections in their Summary of Economic Projections for the year from 2 to 1. Supporting their stance, inflation remains above the Fed’s 2% target; recession risks appear contained and fears of repeating the premature cuts of the 1970’s haunt. For students of history and masters of economic models informed by history, staying “data dependent” appears appropriate. However, Powell wasn’t trained by and paid for within the private sector to look backward. Powell was paid to look forward. Powell wasn’t paid to be “data dependent”, Powell was paid to be “outlook dependent”.
Right now, the Fed has left rates unchanged since the last hike in July of 2023. That’s a much longer pause than usual:

Because of the systematic dispersion of monetary policy, leaving rates “higher for longer” ferments unintended consequences and increases recession risks. For instance, tight Fed policy may not always cause a recession, but it often does. Consider the following time lapses between last hikes and recession onsets:

With 12 months having elapsed since his last hike, Jerome has to fear overstaying his tightness. Investors, like Powell, rely heavily on mean reversion and probability theory to make forward-looking judgments. Knowing the information above, Powell should rightly be getting nervous by now. That’s what surfaced at his press conference last month, and that’s what lurked within his testimony on Capitol Hill this week. Powell WANTS to cut rates, but he needed a defining data point to break the backward-looking gridlock on the FOMC. He received that data point on Thursday.
Powell’s Proof
Following Powell’s dovish testimony before Congress on Tuesday and Wednesday, the Bureau of Labor Statistics released its June Consumer Price Index (CPI) inflation report. Overall, inflation fell by .1% in June. Over the past year, CPI has disinflated to 3%, the lowest overall inflation level since March of 2021. For those backward-looking, 3% is obviously 50% above the Fed’s 2% target. Those looking forward recognize that the badly lagging shelter component distorts the true underlying inflation rate. Subtracting shelter inflation (36% weight within CPI) produces an overall inflation rate of 1.8%, well below the Fed’s target. With sticky shelter inflation in steady decline, future inflation reports will fall further. Note the lag between shelter inflation in blue and non-shelter inflation in red:

Source: https://fred.stlouisfed.org/graph/?g=1q6h4
This report provided the proof and relief that Jerome Powell needed. Future traders have now priced in a 90% chance that the Fed will cut rates by .25% in September, and a 6% chance they will cut them by .5%. Markets reacted pleasantly and violently.
The Rate Cut Playbook
Smaller companies tend to borrow more money as a percentage of assets than larger cap companies. They also tend to get acquired more when rates are lower. For these reasons and others, small cap stocks have historically benefited far more during Fed rate cut cycles than large cap stocks. Note the performance differentials below:

As such, Thursday’s CPI release immediately activated a historic rotation out of large cap stocks and into small cap stocks. Note the performance differentials on the day:

The largest capitalization companies within the Russell 1000 fell .21%, while the smallest capitalization companies rose 3.51%. The much-vaunted Magnificent 7 cohort fell 4.5% on the day, led lower by AI star Nvidia’s 6% decline—a clear source of funding for the rate cut rotation. By the end of trading Thursday, the S&P 500 fell nearly 1% while the Russell 2000 small cap index rose 3.5%. This was the fourth largest underperformance by the S&P 500 to the Russell 2000 since 1979.
Just as the backward-looking FOMC members favor higher rates, backward-looking investors favor large cap US stocks. Forward-looking cohorts must now consider rate cuts… and investments beyond the Magnificent 7.
Have a great weekend!
-David
Sources: FRB, Haver Analytics, Apollo Chief Economist, Federal Reserve Board, FRED, Bespoke
This communication and its contents are for informational and educational purposes only and should not be used as the sole basis for any investment decision. The information contained herein is based on publicly available sources believed to be reliable but is not a representation, expressed or implied, as to the accuracy, completeness, or correctness of said information. Past performance does not guarantee future results.
">Jay Day The Full Story:Federal Reserve Chief Jerome Powell is not an economist. Jerome studied politics at Princeton and obtained a law degree from Georgetown. He worked as an investment banker for Dillon, Read & Co., in capital markets at the US Treasury, led corporate finance at Bankers Trust, and identified, developed, and divested industrial businesses within private equity mega-firm, The Carlyle Group. Of the 12 voting members of the FOMC, eight have a Ph.D in economics. Other than Jerome Powell, the three who do not hold a Ph.D. in economics include a regulator and community banker (Michelle Bowman), a public policy professor (Michael Barr), and a consultant (Thomas Barkin). Only Jay Powell has a background in operating within capital markets, making go/no-go investment decisions, and structuring finance packages based on projections.
We made note of Powell’s visible discomfort at the last FOMC press conference on June 12th. The Committee opted to leave rates unchanged and reduced their rate cut projections in their Summary of Economic Projections for the year from 2 to 1. Supporting their stance, inflation remains above the Fed’s 2% target; recession risks appear contained and fears of repeating the premature cuts of the 1970’s haunt. For students of history and masters of economic models informed by history, staying “data dependent” appears appropriate. However, Powell wasn’t trained by and paid for within the private sector to look backward. Powell was paid to look forward. Powell wasn’t paid to be “data dependent”, Powell was paid to be “outlook dependent”.
Right now, the Fed has left rates unchanged since the last hike in July of 2023. That’s a much longer pause than usual:
Because of the systematic dispersion of monetary policy, leaving rates “higher for longer” ferments unintended consequences and increases recession risks. For instance, tight Fed policy may not always cause a recession, but it often does. Consider the following time lapses between last hikes and recession onsets:
With 12 months having elapsed since his last hike, Jerome has to fear overstaying his tightness. Investors, like Powell, rely heavily on mean reversion and probability theory to make forward-looking judgments. Knowing the information above, Powell should rightly be getting nervous by now. That’s what surfaced at his press conference last month, and that’s what lurked within his testimony on Capitol Hill this week. Powell WANTS to cut rates, but he needed a defining data point to break the backward-looking gridlock on the FOMC. He received that data point on Thursday.
Powell’s Proof
Following Powell’s dovish testimony before Congress on Tuesday and Wednesday, the Bureau of Labor Statistics released its June Consumer Price Index (CPI) inflation report. Overall, inflation fell by .1% in June. Over the past year, CPI has disinflated to 3%, the lowest overall inflation level since March of 2021. For those backward-looking, 3% is obviously 50% above the Fed’s 2% target. Those looking forward recognize that the badly lagging shelter component distorts the true underlying inflation rate. Subtracting shelter inflation (36% weight within CPI) produces an overall inflation rate of 1.8%, well below the Fed’s target. With sticky shelter inflation in steady decline, future inflation reports will fall further. Note the lag between shelter inflation in blue and non-shelter inflation in red:
Source: https://fred.stlouisfed.org/graph/?g=1q6h4
This report provided the proof and relief that Jerome Powell needed. Future traders have now priced in a 90% chance that the Fed will cut rates by .25% in September, and a 6% chance they will cut them by .5%. Markets reacted pleasantly and violently.
The Rate Cut Playbook
Smaller companies tend to borrow more money as a percentage of assets than larger cap companies. They also tend to get acquired more when rates are lower. For these reasons and others, small cap stocks have historically benefited far more during Fed rate cut cycles than large cap stocks. Note the performance differentials below:
As such, Thursday’s CPI release immediately activated a historic rotation out of large cap stocks and into small cap stocks. Note the performance differentials on the day:
The largest capitalization companies within the Russell 1000 fell .21%, while the smallest capitalization companies rose 3.51%. The much-vaunted Magnificent 7 cohort fell 4.5% on the day, led lower by AI star Nvidia’s 6% decline—a clear source of funding for the rate cut rotation. By the end of trading Thursday, the S&P 500 fell nearly 1% while the Russell 2000 small cap index rose 3.5%. This was the fourth largest underperformance by the S&P 500 to the Russell 2000 since 1979.
Just as the backward-looking FOMC members favor higher rates, backward-looking investors favor large cap US stocks. Forward-looking cohorts must now consider rate cuts… and investments beyond the Magnificent 7.
Have a great weekend!
-David
Sources: FRB, Haver Analytics, Apollo Chief Economist, Federal Reserve Board, FRED, Bespoke
This communication and its contents are for informational and educational purposes only and should not be used as the sole basis for any investment decision. The information contained herein is based on publicly available sources believed to be reliable but is not a representation, expressed or implied, as to the accuracy, completeness, or correctness of said information. Past performance does not guarantee future results.
" class="link-chevron">
While we spend much of our energy looking forward, and we will devote many watts to our upcoming Halftime Outlook, it seems appropriate, and it is indeed satisfying, to look back at a very profitable 2024 first half.
Recall that as strategists, we entered the year taking the “over” on performance. We anticipated that Wall Street’s lukewarm optimism and the market’s tendency to rise more rather than less would pleasantly surprise investors. At the start of the year, Wall Street expected a measly gain for the S&P 500 of 4% for 2024. Fearing that consumer exhaustion, sticky inflation, lofty valuations, and punitive interest rates would limit economic momentum and cap market appreciation, here were the tepid targets:

America’s biggest bank, JP Morgan, had the lowest target, expecting the S&P 500 to close 2024 at 4200 after finishing 2023 at 4770, for a loss of 12%. Ed Yardeni, one of Wall Street’s finest sages, foresaw a more uplifting gain of 13% to 5400. The consensus averaged a forecasted gain of less than 2%. We did not put forth a number other than to observe that without a recession, and with the earnings recession ending, the market had a higher probability of upside surprise than downside surprise and that prevailing pessimism only increased favorable odds. As of 2024’s halfway point, the S&P 500 stands at 5,460, 15% higher than the start of the year and 2% higher than Wall Street’s most optimistic forecaster… proving once again that in this business, when pessimism prevails, optimism pays!
Where the Gains Are
A substantial amount of this year’s gain for the S&P 500 can be attributed to the performance of the AI superstar, Nvidia. Nvidia appreciated 150% in the first half, reaching a market cap peak of $3.3 trillion, briefly making it the most valuable company in the world. Removing Nvidia’s gain from the S&P 500 removes about a third of the overall advance. Even still, a 10% first half advance ex-Nvidia still annualizes out to a 20% full year advance – a highly hearty pace. But the gains were not restricted to Nvidia and big cap tech. Beneath the large caps, the mid-caps (ETF: MDY) advanced 6% while the small caps (ETF: IWM) inched up 1%. Offshore, the All-Cap World Index ex-USA (ETF: ACWX) levitated nearly 6%, while the currency hedged version (ETF: HAWX) gained more than 11%. Emerging market indices (ETF: EEM) rose over 6% and more than 10% with the currencies hedged (ETF: HEEM).
Overall, it’s been difficult for stock investors to NOT make money in 2024. For bond investors, it’s been a little trickier with bond indices (ETF: AGG, LQD, HYG) mostly breakeven year-to-date. Commodity investors have enjoyed sizable gains in oil and precious metals, more than offsetting losses in natural gas and grains, delivering 6% gains overall (ETF: DBC). Any way you slice it, concentrated and balanced investors alike have more in 2024.
Have a great weekend!
-David
Sources: Bloomberg’s ANR Data
This communication and its contents are for informational and educational purposes only and should not be used as the sole basis for any investment decision. The information contained herein is based on publicly available sources believed to be reliable but is not a representation, expressed or implied, as to the accuracy, completeness, or correctness of said information. Past performance does not guarantee future results.
">Happy Halftime!
While we spend much of our energy looking forward, and we will devote many watts to our upcoming Halftime Outlook, it seems appropriate, and it is indeed satisfying, to look back at a very profitable 2024 first half.
Recall that as strategists, we entered the year taking the “over” on performance. We anticipated that Wall Street’s lukewarm optimism and the market’s tendency to rise more rather than less would pleasantly surprise investors. At the start of the year, Wall Street expected a measly gain for the S&P 500 of 4% for 2024. Fearing that consumer exhaustion, sticky inflation, lofty valuations, and punitive interest rates would limit economic momentum and cap market appreciation, here were the tepid targets:
America’s biggest bank, JP Morgan, had the lowest target, expecting the S&P 500 to close 2024 at 4200 after finishing 2023 at 4770, for a loss of 12%. Ed Yardeni, one of Wall Street’s finest sages, foresaw a more uplifting gain of 13% to 5400. The consensus averaged a forecasted gain of less than 2%. We did not put forth a number other than to observe that without a recession, and with the earnings recession ending, the market had a higher probability of upside surprise than downside surprise and that prevailing pessimism only increased favorable odds. As of 2024’s halfway point, the S&P 500 stands at 5,460, 15% higher than the start of the year and 2% higher than Wall Street’s most optimistic forecaster… proving once again that in this business, when pessimism prevails, optimism pays!
Where the Gains Are
A substantial amount of this year’s gain for the S&P 500 can be attributed to the performance of the AI superstar, Nvidia. Nvidia appreciated 150% in the first half, reaching a market cap peak of $3.3 trillion, briefly making it the most valuable company in the world. Removing Nvidia’s gain from the S&P 500 removes about a third of the overall advance. Even still, a 10% first half advance ex-Nvidia still annualizes out to a 20% full year advance – a highly hearty pace. But the gains were not restricted to Nvidia and big cap tech. Beneath the large caps, the mid-caps (ETF: MDY) advanced 6% while the small caps (ETF: IWM) inched up 1%. Offshore, the All-Cap World Index ex-USA (ETF: ACWX) levitated nearly 6%, while the currency hedged version (ETF: HAWX) gained more than 11%. Emerging market indices (ETF: EEM) rose over 6% and more than 10% with the currencies hedged (ETF: HEEM).
Overall, it’s been difficult for stock investors to NOT make money in 2024. For bond investors, it’s been a little trickier with bond indices (ETF: AGG, LQD, HYG) mostly breakeven year-to-date. Commodity investors have enjoyed sizable gains in oil and precious metals, more than offsetting losses in natural gas and grains, delivering 6% gains overall (ETF: DBC). Any way you slice it, concentrated and balanced investors alike have more in 2024.
Have a great weekend!
-David
Sources: Bloomberg’s ANR Data
This communication and its contents are for informational and educational purposes only and should not be used as the sole basis for any investment decision. The information contained herein is based on publicly available sources believed to be reliable but is not a representation, expressed or implied, as to the accuracy, completeness, or correctness of said information. Past performance does not guarantee future results.
" class="link-chevron">
The Federal Reserve’s FOMC meeting results this week were a snooze fest. The Fed has now held rates steady at 5.5% for 12 months. They project only one .25% cut sometime later this year. OK. The longest the Fed has ever held rates “higher for longer” was between June of 2006 and September of 2007, at 5.25%.
Over that period, consumer price inflation fell from 4.1% to 2.3%. The Fed cut rates at that September meeting, not to abandon its steady and noble inflation fight, but to respond to the financial instability fermenting within credit markets.
Ironically, inflation surged following their first rate cut due to a surge in oil prices and a delayed response in owner equivalent rents due to the previous run up in housing prices. The consumer price index hit 5.5% in July of 2008 only to collapse down to -2% by July of 2009. By that point the Fed had cut rates to zero in a breathless attempt to catch up. The last time the Fed hit snooze this long, they got a rude awakening.

It’s not easy running the largest central bank in the world. Ideally, Chair Powell and the Federal Open Market Committee that sets monetary policy would simply divine a mix where unemployment remains perpetually at 4%, while inflation remains perpetually at 2%. Set it and forget it!
Unfortunately, the economy has a few other inputs directing traffic besides Fed policy. How much economic influence does the Fed have? This question seldom gets asked. Based upon the press’s obsession with every official’s latest word, you would expect it to be absolute, but that’s not accurate.
Fiscal policy, geopolitics, weather events, housing trends, pandemics, etc. all have a say in the direction of macroeconomics. Furthermore, each input holds a different weight depending upon the circumstances and degree of force.
The Fed’s Dot Plot
When the Fed emptied the silos during COVID, the economy responded. When the Fed backstopped the banking system with unlimited guarantees after Silicon Valley Bank and First Republic failed, the economy responded. However, these major, influential policy moments followed major influential moments fostered outside the Fed. While they try, the Fed doesn’t really predict the future, they read the present and react to the past.
On Wednesday the Fed hardened its “do nothing” stance. The Fed’s Dot Plot, a reading of each member’s Fed Funds rate forecast, eliminated two rate cuts at the median, leaving only one anticipated by year end. Note the consolidation of opinion as we compare the March Dot Plot with the June Dot Plot:

If they cut in September, it will tie their “higher for longer” record, if they wait until December, it will be their longest “higher for longer” streak ever. While I am not suggesting that this inertia invites another Great Financial Crisis, I am suggesting that Fed Funds lingering at 5.5% deserves a bit more scrutiny. So, this week let’s take a deeper look at some key dashboard data, sneak inside the FOMC, and plot our own dot for the Dot Plot.
GDP: Too Hot?

The US economy grew 1.3% in the first quarter. Within the Summary of Economic Projections, the FOMC members forecast a 2.1% GDP growth rate, overall, for 2024 and a 2% GDP growth rate, overall, for 2025 and 2026. With GDP currently running below potential and the Fed forecasting GDP at potential, does the economy appear overheated?
Employment: Too Hot?
The May unemployment report spooked markets when, reportedly, the U.S. economy added 272,000 jobs versus consensus additions of 195,000. This number contains many adjustment factors, some of which will appear in the 2nd and 3rd revisions. So far this year, the initial payroll reports claim that the U.S. has added 1.1 million jobs, but revisions deducted 13% of those jobs.
We shall see the size of revisions that await the May report, but even Powell expressed some doubt over the recent payroll additions at his press conference, stating that there is an “argument that job gains may be a bit overstated.” Furthermore, “We are seeing a gradual cooling in the labor market.” Using another data set, let’s examine a measure Powell has referenced to judge the “balance” within the labor market:

This chart chronicles the number of jobs available for each unemployed worker. The jobs available per unemployed worker averaged 1.2 prior to the pandemic, shot up to 2+ when stimulus stoked labor shortages, and has now returned to 1.2 with clear momentum to the downside. With the unemployment rate up .5% from cycle lows and the amount of job openings per unemployed worker back to pre-COVID levels, does the labor market appear overheated?
Inflation, Too Hot?
The Fed has a 2% inflation target. They reference core PCE as their preferred measure of inflation. Core PCE inflation registered at 2.7% within the April report. 2.7% is more than 2%. For a more recent look at inflation, we received the May CPI inflation report this week. According to that report, consumer price inflation registered at 3.4%, also higher than 2%. However, housing inflation holds substantial influence within each measure (twice as much within CPI as PCE). Things look very different when you eliminate housing inflation from the calculation:

Subtracting housing inflation from CPI results in an inflation rate of 2.1% in May, well within the Fed’s target range. As we know, housing inflation measures lag, given the infrequency with which housing “re-prices.” More recent measures of rent, such as the Apartment List National Rent Index preview, show where lagging CPI and PCE housing measures are headed:

Clearly, listed rent inflation measures peaked well over a year before CPI rent inflation measures peaked. As long as current housing measures remain disinflationary, lagging housing measures will disinflate. With inflation ex-housing levels near the Fed’s target and housing disinflation crawling consistently lower, does inflation appear overheated?
FOMC Me
Taken together, the effective Fed Funds rate, at 5.33%, is now 2.6% above the core PCE inflation rate of 2.7%. That’s pretty tight, and policy gets tighter every month inflation falls further.

Over the last 40 years, the Fed Funds rate has averaged 1.2% more than the core PCE inflation rate. Applying that policy standard would place the Federal Funds rate 1.4% lower, closer to 4% vs. 5.3% today.
The Fed projected this week that Core PCE inflation will end the year at 2.8%. The April PCE report fell below that at 2.7%. Furthermore, based upon the data we received this week, economists expect Core PCE inflation will cool further to 2.6% in May. That’s .2% below where the Fed expects us to end the year!
Unless housing inflation reaccelerates meaningfully, it’s hard to foresee inflation rising from here. Either the Fed sees something we don’t see, or the Fed must be sleeping. Returning to our role play, given the analysis above, were we members of the FOMC, we would drop our “Dot Plot” dot three cuts lower to end the year, versus the inert FOMC consensus of one. Given Powell’s observable discomfort at the press conference… perhaps he agrees.

Have a great week!
-David
Sources: FRED, The Federal Reserve, Bureau of Labor Statistics, Apartment List
This communication and its contents are for informational and educational purposes only and should not be used as the sole basis for any investment decision. The information contained herein is based on publicly available sources believed to be reliable but is not a representation, expressed or implied, as to the accuracy, completeness, or correctness of said information. Past performance does not guarantee future results.
">FOMZzz
The Federal Reserve’s FOMC meeting results this week were a snooze fest. The Fed has now held rates steady at 5.5% for 12 months. They project only one .25% cut sometime later this year. OK. The longest the Fed has ever held rates “higher for longer” was between June of 2006 and September of 2007, at 5.25%.
Over that period, consumer price inflation fell from 4.1% to 2.3%. The Fed cut rates at that September meeting, not to abandon its steady and noble inflation fight, but to respond to the financial instability fermenting within credit markets.
Ironically, inflation surged following their first rate cut due to a surge in oil prices and a delayed response in owner equivalent rents due to the previous run up in housing prices. The consumer price index hit 5.5% in July of 2008 only to collapse down to -2% by July of 2009. By that point the Fed had cut rates to zero in a breathless attempt to catch up. The last time the Fed hit snooze this long, they got a rude awakening.
It’s not easy running the largest central bank in the world. Ideally, Chair Powell and the Federal Open Market Committee that sets monetary policy would simply divine a mix where unemployment remains perpetually at 4%, while inflation remains perpetually at 2%. Set it and forget it!
Unfortunately, the economy has a few other inputs directing traffic besides Fed policy. How much economic influence does the Fed have? This question seldom gets asked. Based upon the press’s obsession with every official’s latest word, you would expect it to be absolute, but that’s not accurate.
Fiscal policy, geopolitics, weather events, housing trends, pandemics, etc. all have a say in the direction of macroeconomics. Furthermore, each input holds a different weight depending upon the circumstances and degree of force.
The Fed’s Dot Plot
When the Fed emptied the silos during COVID, the economy responded. When the Fed backstopped the banking system with unlimited guarantees after Silicon Valley Bank and First Republic failed, the economy responded. However, these major, influential policy moments followed major influential moments fostered outside the Fed. While they try, the Fed doesn’t really predict the future, they read the present and react to the past.
On Wednesday the Fed hardened its “do nothing” stance. The Fed’s Dot Plot, a reading of each member’s Fed Funds rate forecast, eliminated two rate cuts at the median, leaving only one anticipated by year end. Note the consolidation of opinion as we compare the March Dot Plot with the June Dot Plot:
If they cut in September, it will tie their “higher for longer” record, if they wait until December, it will be their longest “higher for longer” streak ever. While I am not suggesting that this inertia invites another Great Financial Crisis, I am suggesting that Fed Funds lingering at 5.5% deserves a bit more scrutiny. So, this week let’s take a deeper look at some key dashboard data, sneak inside the FOMC, and plot our own dot for the Dot Plot.
GDP: Too Hot?
The US economy grew 1.3% in the first quarter. Within the Summary of Economic Projections, the FOMC members forecast a 2.1% GDP growth rate, overall, for 2024 and a 2% GDP growth rate, overall, for 2025 and 2026. With GDP currently running below potential and the Fed forecasting GDP at potential, does the economy appear overheated?
Employment: Too Hot?
The May unemployment report spooked markets when, reportedly, the U.S. economy added 272,000 jobs versus consensus additions of 195,000. This number contains many adjustment factors, some of which will appear in the 2nd and 3rd revisions. So far this year, the initial payroll reports claim that the U.S. has added 1.1 million jobs, but revisions deducted 13% of those jobs.
We shall see the size of revisions that await the May report, but even Powell expressed some doubt over the recent payroll additions at his press conference, stating that there is an “argument that job gains may be a bit overstated.” Furthermore, “We are seeing a gradual cooling in the labor market.” Using another data set, let’s examine a measure Powell has referenced to judge the “balance” within the labor market:
This chart chronicles the number of jobs available for each unemployed worker. The jobs available per unemployed worker averaged 1.2 prior to the pandemic, shot up to 2+ when stimulus stoked labor shortages, and has now returned to 1.2 with clear momentum to the downside. With the unemployment rate up .5% from cycle lows and the amount of job openings per unemployed worker back to pre-COVID levels, does the labor market appear overheated?
Inflation, Too Hot?
The Fed has a 2% inflation target. They reference core PCE as their preferred measure of inflation. Core PCE inflation registered at 2.7% within the April report. 2.7% is more than 2%. For a more recent look at inflation, we received the May CPI inflation report this week. According to that report, consumer price inflation registered at 3.4%, also higher than 2%. However, housing inflation holds substantial influence within each measure (twice as much within CPI as PCE). Things look very different when you eliminate housing inflation from the calculation:
Subtracting housing inflation from CPI results in an inflation rate of 2.1% in May, well within the Fed’s target range. As we know, housing inflation measures lag, given the infrequency with which housing “re-prices.” More recent measures of rent, such as the Apartment List National Rent Index preview, show where lagging CPI and PCE housing measures are headed:
Clearly, listed rent inflation measures peaked well over a year before CPI rent inflation measures peaked. As long as current housing measures remain disinflationary, lagging housing measures will disinflate. With inflation ex-housing levels near the Fed’s target and housing disinflation crawling consistently lower, does inflation appear overheated?
FOMC Me
Taken together, the effective Fed Funds rate, at 5.33%, is now 2.6% above the core PCE inflation rate of 2.7%. That’s pretty tight, and policy gets tighter every month inflation falls further.
Over the last 40 years, the Fed Funds rate has averaged 1.2% more than the core PCE inflation rate. Applying that policy standard would place the Federal Funds rate 1.4% lower, closer to 4% vs. 5.3% today.
The Fed projected this week that Core PCE inflation will end the year at 2.8%. The April PCE report fell below that at 2.7%. Furthermore, based upon the data we received this week, economists expect Core PCE inflation will cool further to 2.6% in May. That’s .2% below where the Fed expects us to end the year!
Unless housing inflation reaccelerates meaningfully, it’s hard to foresee inflation rising from here. Either the Fed sees something we don’t see, or the Fed must be sleeping. Returning to our role play, given the analysis above, were we members of the FOMC, we would drop our “Dot Plot” dot three cuts lower to end the year, versus the inert FOMC consensus of one. Given Powell’s observable discomfort at the press conference… perhaps he agrees.
Have a great week!
-David
Sources: FRED, The Federal Reserve, Bureau of Labor Statistics, Apartment List
This communication and its contents are for informational and educational purposes only and should not be used as the sole basis for any investment decision. The information contained herein is based on publicly available sources believed to be reliable but is not a representation, expressed or implied, as to the accuracy, completeness, or correctness of said information. Past performance does not guarantee future results.
" class="link-chevron">